
Analyzing Linear Relationships Worksheets
7th grade math analyzing linear relationships worksheets help students identify proportional patterns, compare rates, connect representations, and explain mathematical relationships. Free, ready-to-print worksheets in PDF format are designed for immediate classroom use, centers, guided practice, homework, or homeschool lessons. Students strengthen proportional reasoning, rate analysis, and representation skills while developing abilities that support curriculum expectations.
About This Collection of Worksheets
Analyzing linear relationships in 7th grade helps students recognize how two quantities change together and determine whether that change follows a consistent proportional rule. Students work with tables, equations, ordered pairs, graphs, and real-world situations while focusing on constants of proportionality, unit rates, and comparisons between relationships. These ideas give students a strong foundation for later work with slope and linear equations.
The collection includes proportionality checks, constant-of-proportionality practice, equation-and-table matching, unit-rate applications, graph interpretation, rate comparisons, missing values, error analysis, representation matching, and plan comparisons. Some worksheets emphasize identifying a rate, while others require students to justify proportionality, compare multiple representations, or explain what a rate means within a real-world context.
Teachers can use these worksheets for direct instruction, guided math, centers, homework, intervention, review, enrichment, or assessment preparation. Parents, tutors, and homeschool educators can begin with tables and constants before moving into graphs, equations, comparisons, and real-world applications. The collection connects closely with CCSS.MATH.CONTENT.7.RP.A.1 for unit rates and CCSS.MATH.CONTENT.7.RP.A.2 for recognizing and representing proportional relationships.

Paul’s Teacher Tip
Encourage students to focus on the relationship between x and y instead of only noticing that both sets of numbers increase. When a table appears proportional, have students check more than one pair to confirm that the same rate is maintained. In equations written as y = kx, remind students that the value multiplying x represents the constant of proportionality. For graphs, connect the point where x equals 1 with the unit rate whenever that interpretation fits. When comparing two relationships, have students find a common rate first rather than judging by whichever representation shows larger numbers.
Worksheet Collection Skill Spotlights
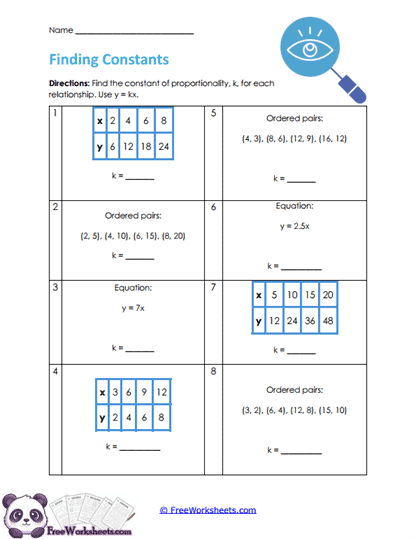
Constant Clues
What Kids Do: Students identify the constant that connects x and y in tables, ordered pairs, and equations. They compare corresponding values, determine the consistent multiplicative relationship, and recognize the same rate even when it is represented in different mathematical forms.
Target Skill: This activity develops constant-of-proportionality reasoning across multiple representations. 7th grade students practice recognizing that tables, ordered pairs, and equations can describe the same proportional relationship and use one consistent rate to connect them.
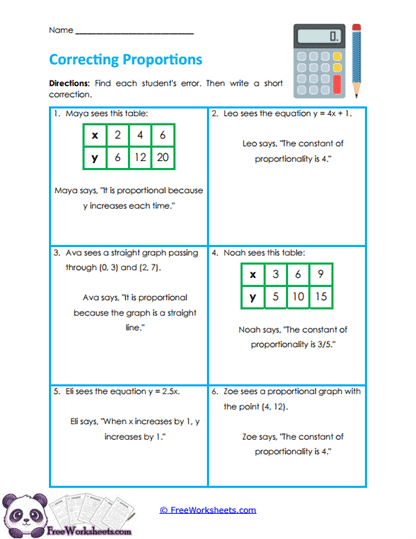
Error Signals
What Kids Do: Students analyze incorrect claims about proportional tables, equations, graphs, and constants of proportionality. They identify the exact misconception, check the relationship using ratios or representation rules, and write a correction supported by mathematical evidence.
Target Skill: This worksheet strengthens error analysis and proportional reasoning. 7th grade students learn to distinguish valid relationships from common misconceptions, including assuming every increasing table or straight-line graph must represent a proportional relationship.
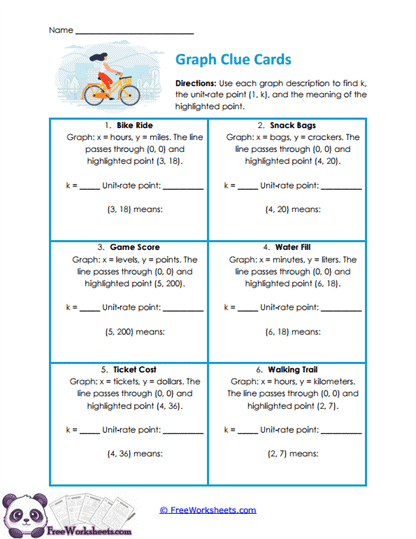
Graph Rates
What Kids Do: Students use proportional graph information and coordinate points to determine unit rates and constants of proportionality. They identify the point associated with one unit of x and explain what highlighted coordinates represent within real-world situations.
Target Skill: This activity develops interpretation of proportional graphs. 7th grade students connect coordinates, unit rates, and real-world meaning while learning that a proportional graph represents one consistent relationship between two changing quantities.
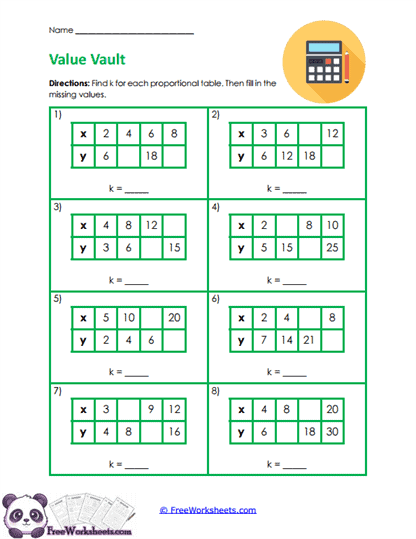
Missing Ratios
What Kids Do: Students complete proportional tables containing missing x- or y-values. They first determine the constant relationship from a known pair, apply that same rule to fill the blanks, and check that every completed pair follows the same proportional pattern.
Target Skill: This worksheet strengthens proportional-table reasoning and unknown-value problem solving. 7th grade students practice using one known rate to generate additional values and recognize multiplication and division as connected ways to move through a proportional table.
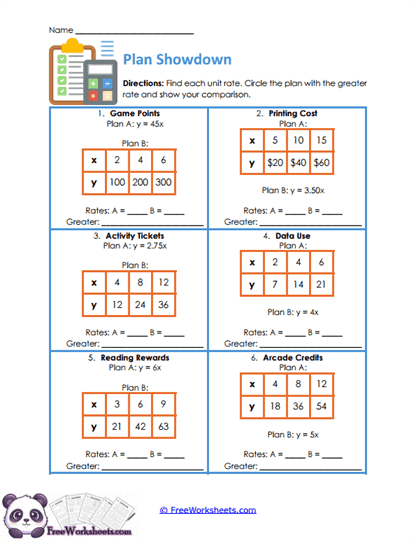
Plan Comparisons
What Kids Do: Students compare two proportional plans shown through equations, tables, or other numerical representations. They find the rate for each plan, record the constants, and decide which relationship has the greater rate based on those values.
Target Skill: This activity develops comparison of proportional relationships across representations. 7th grade students learn to compare rates fairly instead of relying on the largest visible values and build an important foundation for later comparison of linear rates of change.
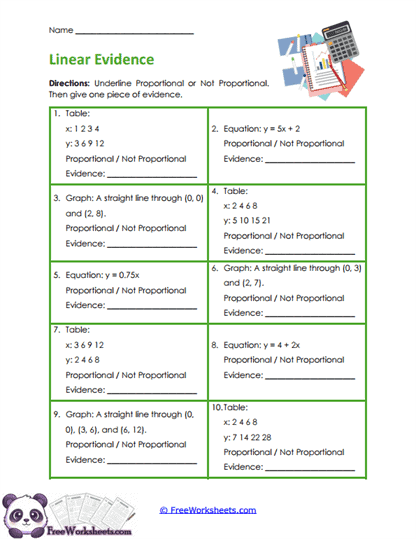
Proportion Proof
What Kids Do: Students examine tables, equations, and graph descriptions and decide whether each relationship is proportional. They then provide evidence by checking constant ratios, looking for an equation in proportional form, or determining whether a graph includes the origin.
Target Skill: This worksheet develops justification of proportional relationships. 7th grade students practice identifying the defining features of proportionality and explaining their decisions with mathematical evidence instead of relying on appearance alone.
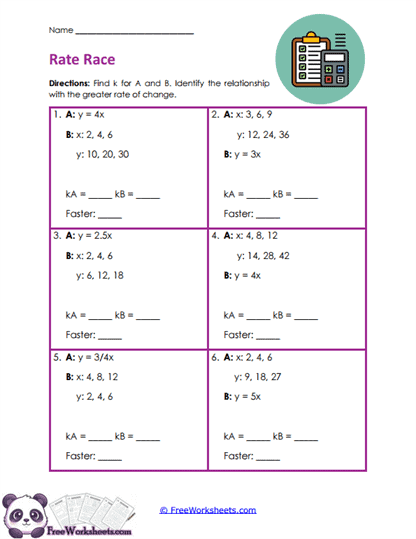
Rate Comparisons
What Kids Do: Students determine rates from equations, tables, and numerical relationships and compare two representations in each problem. They calculate or identify the constant for both relationships and decide which one changes at the greater rate.
Target Skill: This activity strengthens cross-representation rate comparison. 7th grade students practice using a constant rate as a common measure for comparing different forms and avoid confusing larger individual values with a faster-changing relationship.
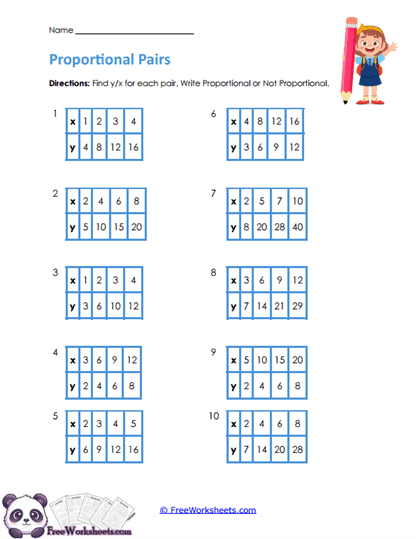
Ratio Checks
What Kids Do: Students study ten x- and y-value tables and determine whether each one maintains a consistent multiplicative relationship. They compare corresponding values, check the rate across multiple pairs, and classify each table as proportional or not proportional.
Target Skill: This worksheet builds foundational proportionality recognition. 7th grade students learn that values increasing together is not enough to prove proportionality and practice verifying that one constant multiplier connects x and y throughout an entire table.
Representation Links
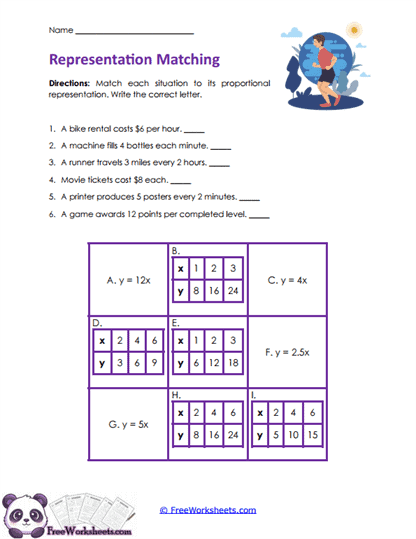
What Kids Do: Students read real-world rate situations and match each one with the equation or table that represents the same relationship. They determine the unit rate in the context, compare it with the mathematical models, and select the representation that preserves that rate.
Target Skill: This activity develops flexible movement among words, equations, and tables. 7th grade students strengthen their understanding that different representations can describe the same proportional relationship when they share an equivalent constant rate.
Table Partners
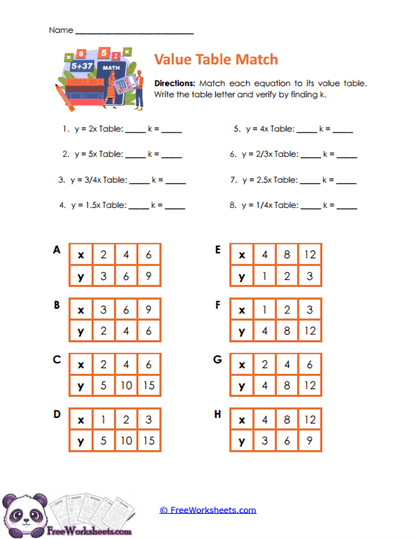
What Kids Do: Students match proportional equations with value tables by examining the multiplier in each equation and checking whether it generates the listed y-values. They then record the constant associated with each correctly matched equation-and-table pair.
Target Skill: This worksheet strengthens connections between algebraic rules and numerical tables. 7th grade students learn to interpret an equation as a rule governing every x-y pair and recognize whole-number, decimal, and fractional constants across representations.
Unit Rates
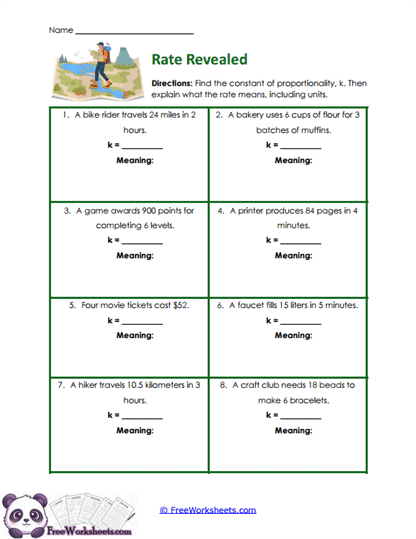
What Kids Do: Students solve real-world problems involving travel, baking, tickets, printing, fuel, hiking, games, and crafts. They determine the amount associated with one unit and then explain what that unit rate means using the quantities and units from the situation.
Target Skill: This activity develops unit-rate calculation and interpretation. 7th grade students practice connecting numerical rates with contextual meaning so values such as cost per item, distance per hour, or output per minute represent understandable relationships.
Winter Rates
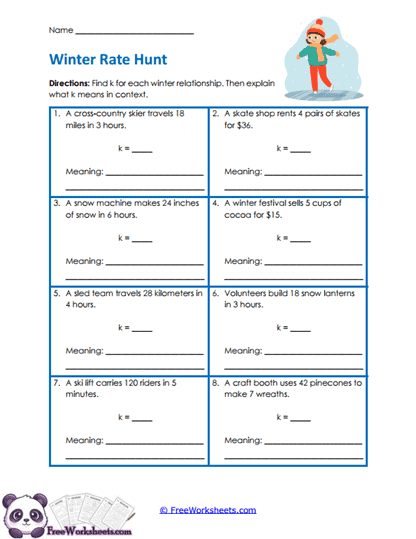
What Kids Do: Students work through winter-themed situations involving skiing, skating, snow machines, cocoa, lifts, lanterns, and crafts. They calculate the unit rate for each relationship and explain what the resulting value represents in the context.
Target Skill: This worksheet strengthens real-world rate interpretation through repeated proportional situations. 7th grade students practice identifying which quantity should be found “for one” and use units to make sure their calculated rate matches the relationship being described.