
About This Worksheet
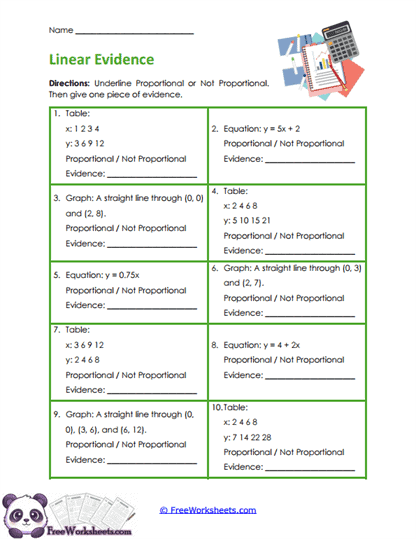
This worksheet helps seventh-grade students decide whether a relationship is proportional and explain how they know. Students look at different representations, including tables, equations, and graph descriptions, then label each one as proportional or not proportional. The important part is the evidence line, where students must justify the choice instead of only circling an answer. This pushes them to use ideas such as constant ratios, equations of the form y = kx, and graphs that pass through the origin. It is a strong reasoning activity because students must recognize the defining features of proportional relationships across several formats.
What Students Practice
Students analyze ten examples and decide whether each relationship is proportional. In a table, they can compare y divided by x to see whether the ratio stays constant. In an equation, they check whether the relationship can be written in the form y = kx without an added constant. For graph descriptions, they consider whether the line passes through the origin. Students then write one piece of evidence that supports their decision, which gives them practice explaining mathematical reasoning clearly.
Why This Matters
Students often learn one shortcut for identifying proportional relationships and then become confused when the information is shown differently. This worksheet helps them see that the same idea can be tested in a table, equation, or graph. A proportional relationship always has a constant rate and includes the origin when graphed, so students begin connecting those clues as parts of one bigger idea. That understanding is important for later work with slope and linear equations. It also helps students avoid assuming that every straight line or every increasing table is automatically proportional.
Teaching Tips
Encourage students to name the kind of evidence they are using before they write it. For a table, they might say that the ratio y/x stays the same; for an equation, they can check whether there is an added or subtracted constant; for a graph, they should look for the point (0,0). If a student says a straight line is proportional just because it is straight, remind them that the line must also pass through the origin. Having students explain one example aloud can make their written evidence much clearer.
Curriculum Standards
This worksheet directly supports CCSS.MATH.CONTENT.7.RP.A.2.A, which asks students to decide whether two quantities are in a proportional relationship. It also reinforces CCSS.MATH.CONTENT.7.RP.A.2.B by helping students recognize constant ratios and proportional equations. The graph examples connect with CCSS.MATH.CONTENT.7.RP.A.2.D, where students interpret proportional graphs and the special role of the origin. The activity works well for guided practice, independent work, homework, or a formative assessment during a Grade 7 proportional relationships unit.