
Graphing Proportional Relationships Worksheets
7th grade math graphing proportional relationships worksheets help students connect tables, equations, ordered pairs, graphs, and unit rates. Free, ready-to-print worksheets in PDF format are designed for immediate classroom use, centers, guided practice, homework, or homeschool lessons. Students strengthen proportional reasoning, coordinate graphing, and representation skills while developing abilities that support curriculum expectations.
About This Collection of Worksheets
Graphing proportional relationships helps 7th grade students see how tables, equations, ordered pairs, and graphs can all describe the same mathematical relationship. Students learn that proportional graphs form straight lines through the origin and that the constant of proportionality controls the rate shown by the graph. These ideas create an important bridge between ratio reasoning and later work with slope and linear equations.
The collection includes table-to-graph activities, equation graphing, proportionality tests, constant-of-proportionality practice, point interpretation, representation matching, missing-point tasks, error analysis, rate comparisons, unit-rate graphing, real-world graph construction, and contextual graph interpretation. Some worksheets emphasize plotting accurately, while others ask students to explain what points and rates mean or compare relationships across different forms.
Teachers can use these worksheets for direct instruction, guided math, centers, homework, intervention, enrichment, review, or assessment preparation. Parents, tutors, and homeschool educators can begin with tables and equations before moving into graph interpretation and comparison. The collection aligns especially well with CCSS.MATH.CONTENT.7.RP.A.2 for recognizing and representing proportional relationships, including identifying constants, writing equations, and interpreting graphs.

Paul’s Teacher Tip
Have students find the constant of proportionality before they start graphing whenever the information makes that possible. Remind them that a proportional graph must form a straight line through the origin, not simply any straight line. When plotting ordered pairs, encourage students to say “x first, y second” and check the scale on both axes before placing points. For interpretation problems, require students to include the units in their explanation of a coordinate or rate. When comparing two graphs, focus on the rate each line represents rather than only how high a particular point appears.
Worksheet Collection Skill Spotlights
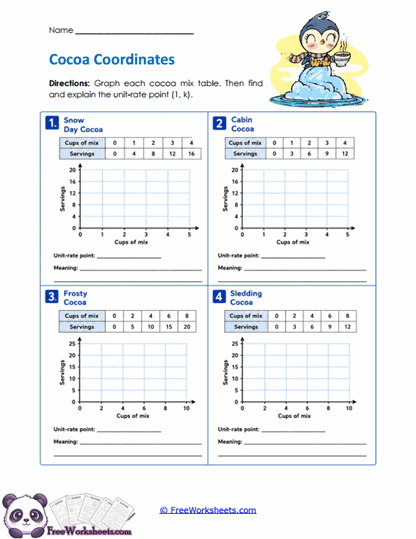
Cocoa Graphs
What Kids Do: Students use proportional cocoa-mix tables to write ordered pairs, plot them on coordinate planes, and draw straight lines through the origin. They then identify the unit-rate point and explain what that point represents using cups of mix and servings.
Target Skill: This activity develops connections among tables, graphs, and unit rates. 7th grade students practice recognizing that the point where x equals one can reveal the constant rate and learn to explain graphical information using real-world units.
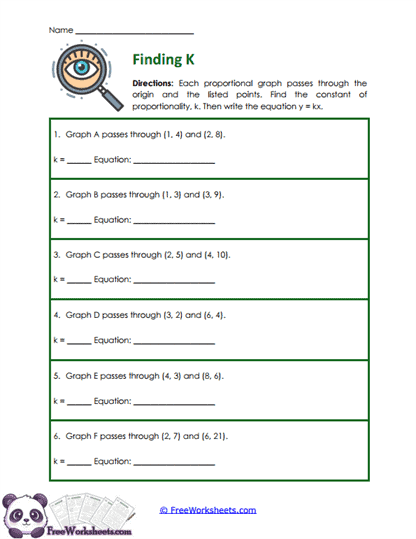
Constant Lines
What Kids Do: Students examine coordinate points from proportional graphs, divide corresponding y- and x-values to determine the constant rate, and use that value to write an equation in proportional form. They verify the rate using more than one point.
Target Skill: This worksheet strengthens the connection between coordinate data and algebraic rules. 7th grade students practice finding a constant from a graph and using it to represent the entire relationship with an equation.
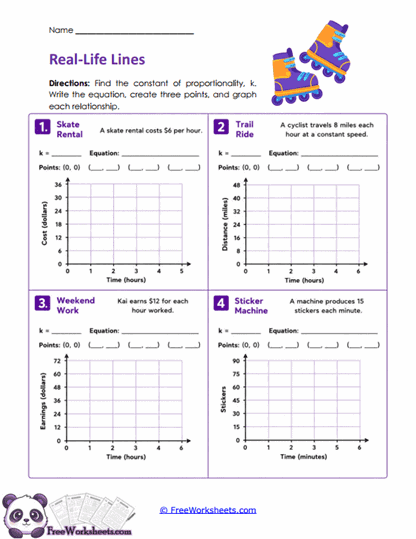
Context Lines
What Kids Do: Students begin with real-world rate situations involving rentals, cycling, earnings, and production. They determine the rate, write an equation, generate ordered pairs, plot those points, and draw the proportional line.
Target Skill: This activity develops full representation modeling from words to equations and graphs. 7th grade students learn how one unit rate becomes the constant in an equation and also controls the pattern of points on the coordinate plane.
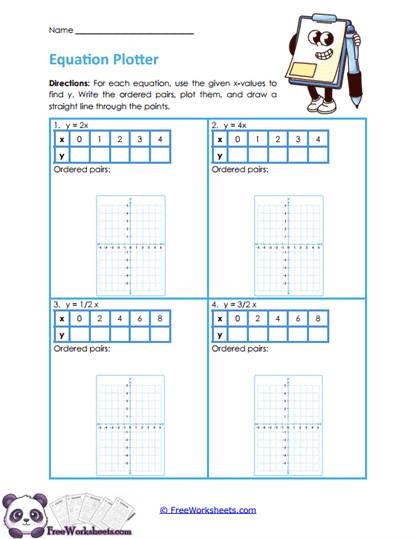
Equation Graphs
What Kids Do: Students substitute given x-values into proportional equations, calculate the corresponding y-values, write ordered pairs, and plot them accurately. They then connect the points with a straight line representing the relationship.
Target Skill: This worksheet develops fluency moving from equations to graphs. 7th grade students practice using a proportional rule to generate coordinates and understand that the multiplier in the equation determines how quickly the graph rises.
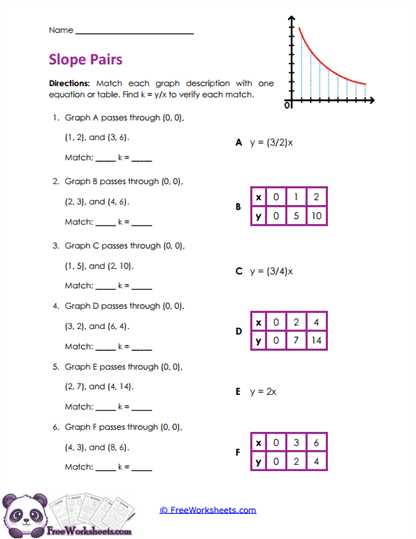
Graph Matches
What Kids Do: Students find the constant of proportionality from graph descriptions and match each one with an equation or value table showing the same rate. They verify matches by comparing the relationship across representations.
Target Skill: This activity strengthens flexible movement among graphs, equations, and tables. 7th grade students practice reducing each representation to a common constant rate so they can determine whether different-looking models describe the same relationship.
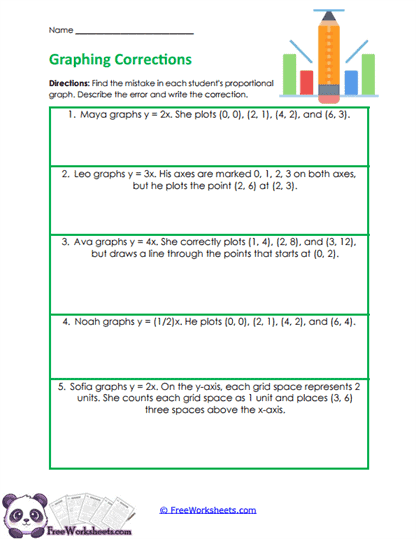
Graph Repairs
What Kids Do: Students inspect descriptions of incorrect proportional graphs involving coordinate placement, scale, equations, and the origin. They identify the first mistake, explain why the graph is inaccurate, and describe how it should be corrected.
Target Skill: This worksheet develops graph error analysis and mathematical explanation. 7th grade students practice checking points against equations, reading axis scales carefully, and recognizing why proportional graphs must include the origin.
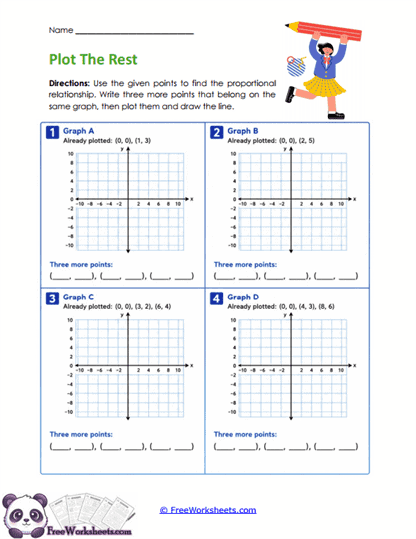
Missing Points
What Kids Do: Students analyze given points on proportional graphs and determine additional ordered pairs that follow the same constant relationship. They plot the new points and connect them with the existing coordinates to extend the proportional line.
Target Skill: This activity develops prediction and graph extension. 7th grade students learn that every point on a proportional graph follows the same rule and use that rule to generate new coordinates rather than treating plotted points as unrelated values.
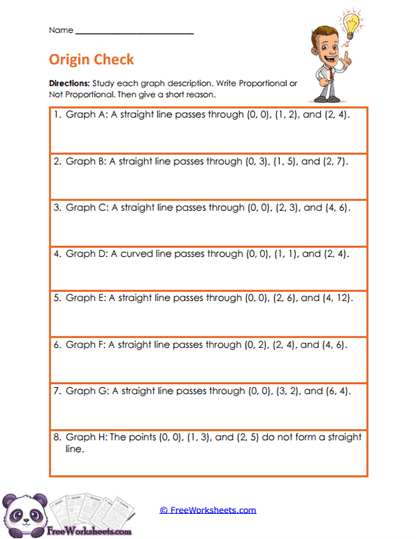
Origin Test
What Kids Do: Students read descriptions of graphs and decide whether each one represents a proportional relationship. They check whether the graph is straight and whether it passes through the origin, then explain the evidence supporting their classification.
Target Skill: This worksheet strengthens visual recognition of proportionality. 7th grade students learn that both conditions matter and avoid common misconceptions such as assuming every straight line or every graph through the origin must be proportional.
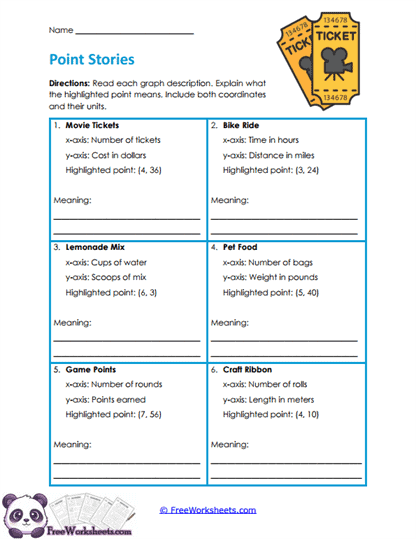
Point Meaning
What Kids Do: Students interpret highlighted ordered pairs from real-world proportional graphs involving tickets, bike rides, food, games, and materials. They connect the x-coordinate and y-coordinate to the correct axis labels and explain the point in a complete sentence.
Target Skill: This activity develops contextual graph interpretation. 7th grade students practice reading coordinate pairs as meaningful relationships between quantities and strengthen their understanding that graph points represent real combinations of values.
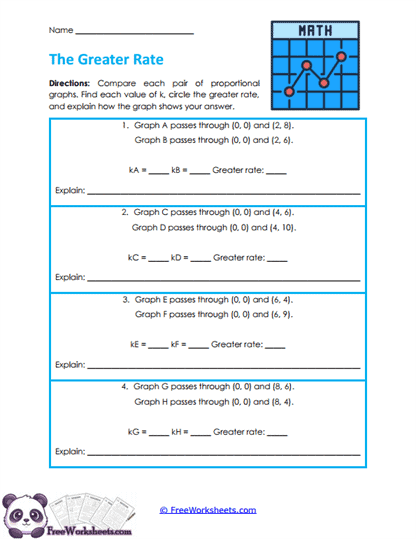
Rate Slopes
What Kids Do: Students compare two proportional graphs by finding the constant rate from coordinate points on each line. They determine which relationship has the larger rate and explain how that difference appears through the steepness of the graph.
Target Skill: This worksheet develops comparison of graphical rates and builds preparation for slope. 7th grade students connect a larger constant of proportionality with a faster rise in y for each unit increase in x.
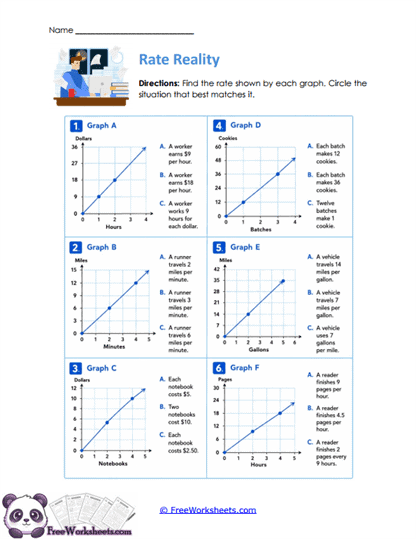
Rate Stories
What Kids Do: Students examine proportional graphs from real-world situations, determine the rate represented by each line, and choose the statement that correctly describes the relationship. They use both numerical values and units to verify each interpretation.
Target Skill: This activity strengthens graph-to-context reasoning. 7th grade students practice distinguishing rates with reversed units and learn that a graph’s meaning depends on both the numerical rate and the quantities represented on its axes.
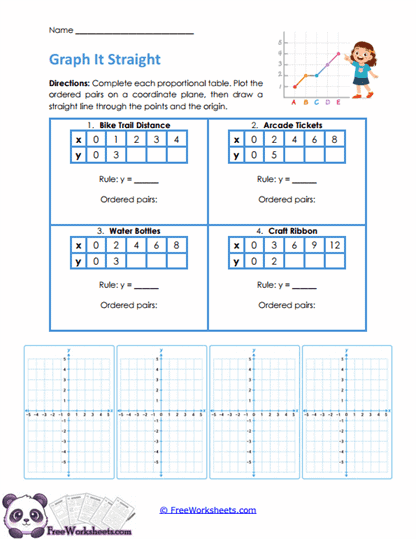
Table Graphs
What Kids Do: Students complete proportional tables, identify the rule connecting x and y, write ordered pairs, plot those points, and draw a line through the origin. They use the same relationship across several forms within each problem.
Target Skill: This worksheet develops connections among tables, equations, coordinates, and graphs. 7th grade students practice recognizing that all four representations describe one consistent proportional relationship and can be used to check one another.