
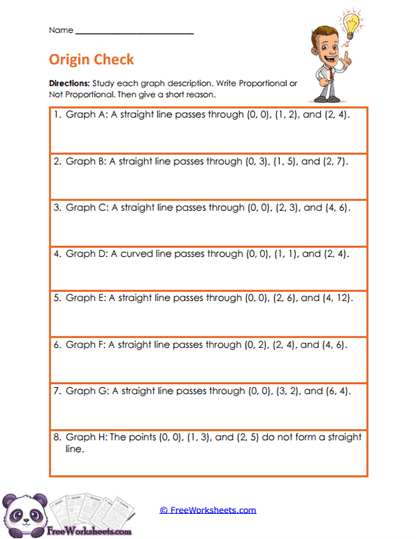
About This Worksheet
This worksheet helps seventh-grade students decide whether a graph description represents a proportional relationship. Students read short descriptions of straight or curved graphs and pay close attention to whether the graph passes through the origin. They then label each one as proportional or not proportional and explain their reasoning. The activity focuses on one of the most important visual rules for proportional graphs: the graph must be a straight line through (0,0). This gives students a quick but thoughtful way to analyze proportionality without needing to draw every graph.
What Students Practice
Students examine descriptions that include coordinate points and information about whether the graph is straight or curved. They use the location of the origin and the pattern of the points to decide whether the relationship is proportional. Some examples are straight lines that do not pass through (0,0), while others pass through the origin but do not form a straight line. This forces students to remember that both conditions matter. Students also explain their decision, which strengthens mathematical reasoning and communication.
Why This Matters
A common mistake is thinking that any straight line must represent a proportional relationship. Another common mistake is thinking that passing through the origin is enough, even if the graph is curved. This worksheet helps students understand that a proportional graph must satisfy both conditions at the same time. That idea becomes very important when they later compare proportional and nonproportional linear relationships. It also lays groundwork for understanding y = kx versus equations with a nonzero starting value.
Teaching Tips
Give students a simple two-question check: “Is it a straight line?” and “Does it pass through (0,0)?” If the answer to either question is no, the relationship is not proportional. Encourage them to use the given points to support their reasoning instead of guessing from the wording. When a graph passes through points like (0,3), point out that the y-value is already above zero when x is zero. This helps students see why the origin matters so much.
Curriculum Standards
This worksheet supports CCSS.MATH.CONTENT.7.RP.A.2.A by asking students to decide whether two quantities are in a proportional relationship. It also aligns with CCSS.MATH.CONTENT.7.RP.A.2.D, which emphasizes interpreting graphs of proportional relationships and recognizing the significance of the point (0,0). The written explanation component reinforces mathematical reasoning and justification. The activity works well for review, homework, small groups, or a quick formative check during a Grade 7 graphing unit.