
About This Worksheet
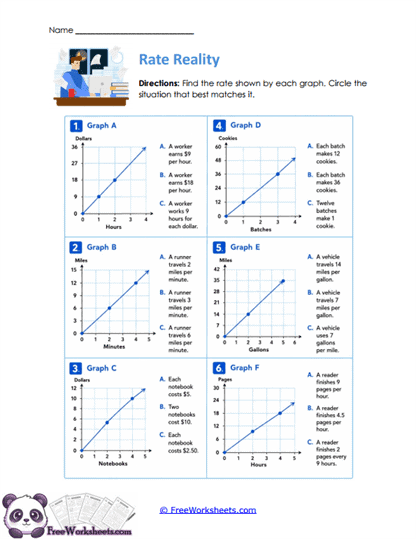
This worksheet helps seventh-grade students interpret rates shown on graphs and connect those rates to real-world descriptions. Each graph shows a proportional relationship involving dollars, miles, notebooks, batches, gallons, or reading pages. Students find the rate from the graph and then choose the statement that best explains what the graph means. This makes the activity more thoughtful than simply reading coordinates because students must connect the numerical rate to a real situation. It is a strong review of graph interpretation and unit-rate meaning.
What Students Practice
Students examine each proportional graph and use the plotted points to determine the constant rate. They may calculate dollars per hour, miles per minute, cost per notebook, cookies per batch, miles per gallon, or pages per hour. After finding the rate, they compare it with the answer choices and select the statement that matches both the number and the units. This requires careful attention to axis labels and the direction of the rate. Students also practice checking that the interpretation makes sense in context.
Why This Matters
Students can sometimes read a graph correctly but still misunderstand what the rate represents. A rate is only meaningful when the units are clear. For example, miles per gallon is very different from gallons per mile even though both use the same two quantities. This worksheet helps students connect graph steepness, unit rates, and context. That understanding is essential for proportional relationships and later work with slope.
Teaching Tips
Have students label the x-axis and y-axis in words before calculating the rate. Then ask what one unit of x corresponds to on the graph. If the rate is not obvious, choose a clear point and calculate y divided by x. Encourage students to read each answer choice carefully and check the units, not just the number. A wrong unit is a good clue that the interpretation does not match the graph.
Curriculum Standards
This worksheet supports CCSS.MATH.CONTENT.7.RP.A.2.D by asking students to interpret points and rates on graphs of proportional relationships. It also reinforces CCSS.MATH.CONTENT.7.RP.A.2.B through finding the constant of proportionality from graph data. The unit-rate calculations connect with CCSS.MATH.CONTENT.7.RP.A.1 as well. The activity works well for independent review, homework, assessment, or preparation for slope and linear-function work.