
About This Worksheet
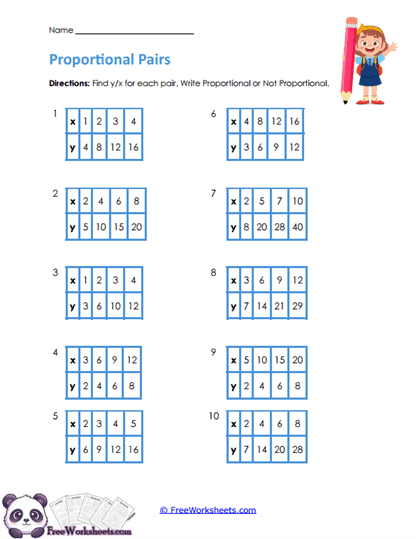
This worksheet helps 7th grade students look closely at pairs of numbers and decide whether the relationship stays the same throughout a table. Students examine several x- and y-value tables, find the relationship between corresponding values, and decide whether each table is proportional or not proportional. In simple terms, a proportional relationship means that the same multiplication rule connects x to y every time. This page helps students move beyond simply noticing that numbers are increasing and instead look for a consistent relationship between them. That kind of thinking is an important early step toward ratios, rates, and linear relationships.
What Students Practice
Students study ten small value tables and compare each x-value with the y-value directly below it. They determine the y-to-x relationship for each pair and check whether that relationship remains constant across the entire table. When the same multiplier works every time, students can classify the table as proportional; when the relationship changes, they identify it as not proportional. The worksheet gives students repeated practice looking for structure instead of relying on how a number pattern appears at first glance. It also encourages them to check every pair rather than deciding after looking at only the first two numbers.
Why This Matters
A child may notice that both rows are getting larger and assume that the table must show a proportional relationship, but that is not always true. What matters is whether y changes by the same factor compared with x every time. Learning to check this relationship carefully helps students understand why some tables follow one dependable rule while others do not. That understanding becomes very important when students later work with rates, graphs, equations, and slope. This worksheet gives them a visual and manageable way to begin making those connections.
Teaching Tips
A good way to introduce the page is to work through one table together and ask, “What do we multiply x by to get y?” Then test that same rule with every other column in the table. If the rule works each time, explain that the relationship is proportional; if it fails even once, the table is not proportional. Encourage students to write the multiplier beside the table when that helps them keep track of their thinking. For students who need extra support, you can also have them divide each y-value by its matching x-value and compare the results.
Curriculum Standards
The proportional-relationship work on this worksheet is more advanced than the main Grade 7 Common Core expectations, so it works especially well as enrichment or preparation for middle-school math. It connects naturally with CCSS.MATH.CONTENT.7.OA.B.3, where fifth-grade students generate and analyze numerical patterns and relationships. More directly, the skill prepares students for CCSS.MATH.CONTENT.7.RP.A.2 and 7.RP.A.3, where they formally work with ratios, unit rates, and proportional relationships. Using this page in Grade 5 can help make that later transition much smoother because students are already learning to search for a consistent multiplicative rule.