
About This Worksheet
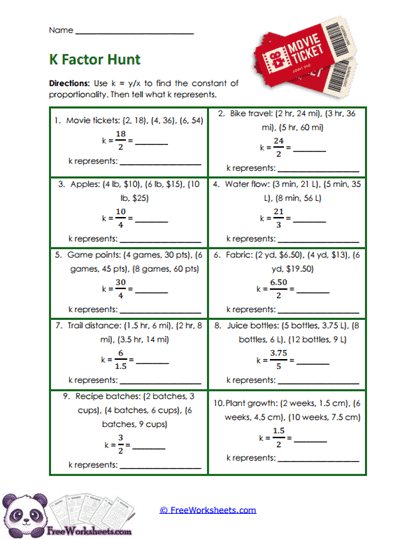
This worksheet helps seventh-grade students find the constant of proportionality from sets of ordered pairs and then explain what that number means in the situation. Students work with examples involving movie tickets, bike travel, apples, water flow, game points, fabric, trail distance, juice bottles, recipe batches, and plant growth. For each one, they use the relationship y/x to calculate k. The worksheet then asks students to explain what k represents in plain language, which keeps the math connected to the real-world context. This makes the activity especially useful for students who can calculate a rate but still need practice understanding what the rate means.
What Students Practice
Students examine ordered pairs and divide the y-value by the matching x-value to find the constant of proportionality. They check that the same value of k works for the other points in the relationship. After finding k, they write what that number represents, such as dollars per ticket, miles per hour, liters per minute, or cups per batch. This gives them practice with ordered pairs, unit rates, proportionality, and interpretation. It also strengthens their ability to move from numerical data to a meaningful real-world statement.
Why This Matters
Students need to understand that k is more than just the result of division. It tells how much of one quantity goes with one unit of another quantity. That idea is the heart of proportional relationships and later becomes closely connected to slope. When students can explain k in words, they are showing that they understand the relationship instead of only following a rule. This makes future work with equations, graphs, and rates much easier to understand.
Teaching Tips
Have students start by choosing one ordered pair and calculating y/x. Then ask them to check a second pair so they can confirm that the same constant appears. Once they find k, have them include the units in their explanation. A helpful sentence starter is, “This means there are ___ for every 1 ___.” If students reverse the division, the units will usually help them spot the mistake.
Curriculum Standards
This worksheet directly supports CCSS.MATH.CONTENT.7.RP.A.2.B, which asks seventh-grade students to identify the constant of proportionality in tables, graphs, equations, diagrams, and verbal descriptions. It also reinforces CCSS.MATH.CONTENT.7.RP.A.1 through unit-rate reasoning. The interpretation portion strengthens students’ ability to explain proportional relationships in context. The activity works well for guided practice, homework, independent review, or small-group instruction.