
About This Worksheet
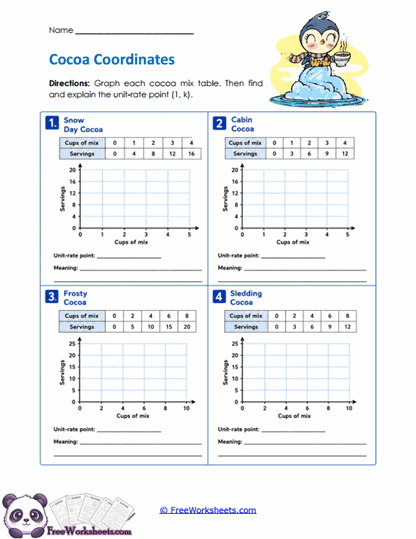
This worksheet helps seventh-grade students graph proportional relationships from tables and then interpret the unit rate shown by each graph. Students work with several cocoa-mix situations where the x-values represent cups of mix and the y-values represent servings. For each table, they plot the ordered pairs, draw the proportional line, identify the unit-rate point, and explain what that point means. This gives students practice connecting tables, graphs, and real-world meaning in one activity. The winter theme keeps the problems familiar while the math stays focused on proportional relationships.
What Students Practice
Students read values from proportional tables and convert them into ordered pairs. They plot the points on coordinate planes and draw a straight line through the data and the origin. After graphing, they identify the unit-rate point, usually where x = 1, and explain that point using cups of mix and servings. This reinforces the idea that the constant of proportionality appears clearly on a graph. Students also practice reading axis labels carefully so they do not reverse the quantities.
Why This Matters
A graph becomes much more useful when students understand what its points actually mean. In a proportional relationship, the point with x = 1 often gives the unit rate directly. That helps students connect graphs with the same “per one” idea they use in tables and equations. This understanding also prepares them for slope, where the rate of change is read from how quickly the graph rises. The worksheet gives students a practical way to see that rate visually.
Teaching Tips
Have students write the ordered pairs before they begin plotting. Remind them that the x-coordinate comes from cups of mix and the y-coordinate comes from servings. After graphing, ask them to find the point where x = 1 and explain that point in a complete sentence. If they are unsure about the rate, have them compare y to x in the table first. This helps them confirm that the graph and table are showing the same relationship.
Curriculum Standards
This worksheet supports CCSS.MATH.CONTENT.7.RP.A.2 by asking students to represent proportional relationships in tables and graphs. It especially connects with CCSS.MATH.CONTENT.7.RP.A.2.B through identifying the constant of proportionality and with 7.RP.A.2.D through interpreting points on a proportional graph. The unit-rate point also reinforces CCSS.MATH.CONTENT.7.RP.A.1. The activity works well for independent practice, homework, small groups, or graphing review.