
About This Worksheet
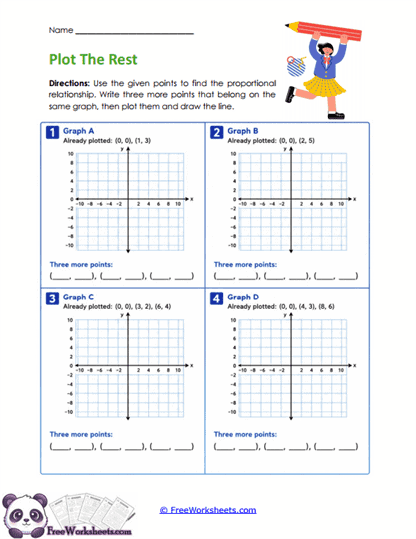
This worksheet helps seventh-grade students extend proportional relationships by finding additional points that belong on a graph. Each problem already gives a few coordinates, including the origin, and students must use the pattern to determine three more ordered pairs. After finding the missing points, they plot them and draw the straight line that represents the relationship. The main idea is that every point on a proportional graph follows the same constant rate. This gives students a hands-on way to connect number patterns, ordered pairs, and graphing.
What Students Practice
Students look at the given coordinates and determine how x and y are related. They use that relationship to generate new ordered pairs that continue the same proportional pattern. After writing the coordinates, students plot them on the coordinate plane and connect the points with a straight line through the origin. This requires careful attention to x-values, y-values, scale, and graph placement. It also reinforces the idea that one constant of proportionality controls every point on the graph.
Why This Matters
Students need to understand that proportional graphs are not made from random points that happen to line up. Every point follows the same rule, and that rule can be used to predict new values. This skill becomes important when students later work with slope, equations, and linear functions. It also helps them see how a graph can represent infinitely many related values, not just the few points shown on the page. Building that understanding now makes later algebra much easier to follow.
Teaching Tips
Have students first find the relationship between x and y before asking them to add any new points. A helpful question is, “What happens to y when x increases by one unit?” Once they know the pattern, encourage them to choose x-values that fit comfortably on the graph. Remind them that every new point should follow the same rule and line up with the points already given. After drawing the line, have them check that it passes through the origin.
Curriculum Standards
This worksheet supports CCSS.MATH.CONTENT.7.RP.A.2 by asking students to represent proportional relationships graphically. It especially connects with CCSS.MATH.CONTENT.7.RP.A.2.B because students use a constant of proportionality to generate new values and with 7.RP.A.2.D because they work with the graph of a proportional relationship through the origin. The activity also strengthens coordinate-plane accuracy and pattern reasoning. It works well for independent practice, homework, intervention, or review before introducing slope more formally.