
About This Worksheet
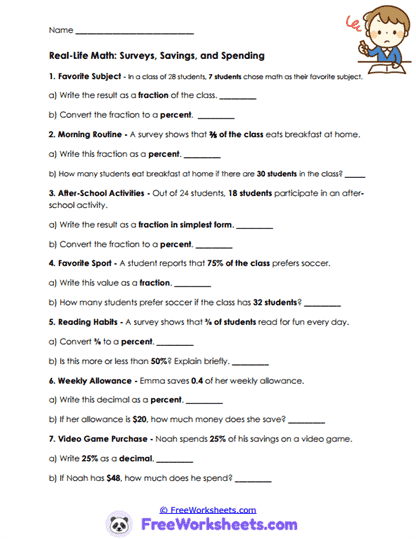
This worksheet helps students use fractions, decimals, and percents to analyze everyday survey and spending situations. Learners solve practical problems involving classroom surveys, breakfast habits, sports preferences, and saving money. These relatable examples help students understand how rational numbers are used to describe real-world data. For example, students may convert a class survey result into a fraction and percent or determine how much money is saved from an allowance. This activity strengthens data interpretation and conversion skills.
Curriculum and Grade Alignment
This worksheet focuses on converting among fractions, decimals, and percents while applying them to survey data and everyday situations. Students should already understand rational-number conversions and basic percent reasoning before beginning this activity. The learning goal is helping learners interpret data and represent it accurately in multiple forms. After mastering this skill, students are better prepared for statistics, financial literacy, and proportional reasoning tasks. The worksheet aligns with Common Core standards 7.RP.A.3 and 7.SP.A.1, along with TEKS 7.2B involving rational-number conversions and data analysis.
Student Tasks
On this worksheet, students will
analyze survey and spending situations using fractions, decimals, and percents. Students convert values between forms and answer questions about classroom data and savings habits. Learners determine percentages from fractions and convert percents into decimals when solving. Several activities encourage students to explain comparisons and interpret results carefully. Students also practice simplifying fractions and checking whether answers are reasonable.
Common Challenges and Misconceptions
Many students confuse percentages and decimals when converting between forms. Some learners forget to simplify fractions after writing survey results. Others may struggle with identifying whether the answer should be written as a fraction, decimal, or percent. Students can also make mistakes interpreting word problems involving class sizes or survey totals. Teachers can help by reviewing one complete example before independent work begins.
Implementation Guidance
Teachers may use this worksheet during data-analysis lessons, rational-number review, or real-world math activities. The survey and spending examples help students connect mathematics to everyday experiences. Parents and homeschool educators can complete one problem together before assigning independent work. Students often benefit from organizing information in charts or notes while solving. This worksheet also works well for homework, intervention groups, or tutoring review.
Details and Features
This printable worksheet includes survey, savings, and classroom-data problems involving fractions, decimals, and percents. The organized layout supports data interpretation and rational-number fluency. Friendly graphics create an engaging learning environment while maintaining focus on mathematics. Problems are designed to strengthen conversion accuracy and real-world application skills. The worksheet prints clearly for classroom instruction, tutoring sessions, or homeschool use.