
About This Worksheet
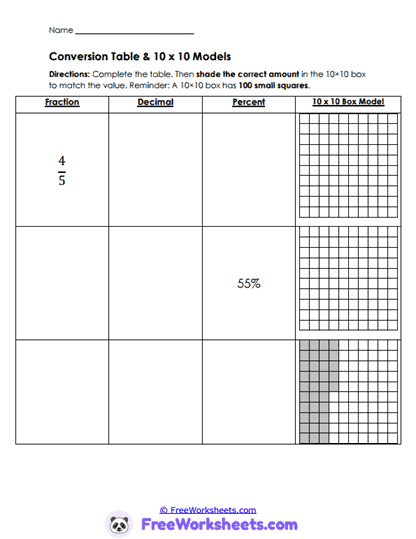
This worksheet helps students connect fractions, decimals, and percents using visual 10-by-10 grid models. Learners complete conversion tables and shade grids to represent equivalent values. Visual models help students understand how percents relate to parts of a whole. For example, students may shade 55 out of 100 squares to represent 55% and connect it to a decimal and fraction. This activity strengthens visual reasoning and conversion understanding.
Curriculum and Grade Alignment
This worksheet focuses on converting fractions, decimals, and percents while using visual area models for support. Students should already understand benchmark fractions, decimal place value, and percent concepts before beginning this activity. The learning goal is helping learners connect symbolic representations to visual models of equivalent values. After mastering this skill, students are better prepared for data analysis, percent applications, and proportional reasoning. The worksheet aligns with Common Core standards 7.RP.A.3 and 7.NS.A.2, along with TEKS 7.2B involving rational-number conversions and visual modeling.
Student Tasks
On this worksheet, students will
complete tables by converting fractions, decimals, and percents into equivalent forms. Students shade 10-by-10 grids to visually represent each value. Learners practice connecting visual models with numerical representations. Several activities encourage students to compare shaded regions with decimal and percent amounts. Students also strengthen understanding of how 100-grid models represent percents out of a whole.
Common Challenges and Misconceptions
Some students shade the wrong number of squares when representing a percent. Others confuse decimal values with whole-number percents. Learners may also struggle to connect visual models with equivalent fractions. Students sometimes count shaded boxes incorrectly or forget that the entire grid equals 100. Teachers can help by modeling one complete example before students begin independent work.
Implementation Guidance
Teachers can use this worksheet during visual-model lessons, percent review, or intervention practice. The grid format helps students see how fractions, decimals, and percents are connected visually. Parents and homeschool educators may work through one shaded model together before assigning independent practice. Students often benefit from counting shaded squares aloud while solving. This worksheet also works well for math stations, homework, or tutoring support.
Details and Features
This printable worksheet combines conversion tables with visual 10-by-10 grid shading models. The organized layout supports conceptual understanding and rational-number fluency. Friendly graphics create an engaging learning environment while maintaining focus on mathematics. Problems are designed to strengthen percent modeling and equivalent-value recognition. The worksheet prints clearly for classroom instruction, tutoring sessions, or homeschool use.