
Interpreting Rate Of Change Worksheets
8th grade math interpreting rate of change worksheets help students understand how one quantity changes compared with another in linear relationships. Free, ready-to-print worksheets in PDF format are designed for immediate classroom use, guided practice, homework, intervention, or homeschool lessons. Students strengthen slope calculation, rate interpretation, and unit reasoning while developing skills that support 8th grade curriculum expectations.
About This Collection of Worksheets
Understanding rate of change helps 8th grade students make sense of how two quantities change together. Students learn that rate of change can describe speed, cost, temperature, distance, savings, water level, battery life, scoring, and many other situations they see outside the math classroom. By connecting numerical rates with familiar contexts, students begin to see slope as a meaningful description of change rather than simply a formula they need to memorize.
This collection gives students practice finding and interpreting rates from tables, equations, ordered pairs, graph points, and real-world descriptions. Activities ask students to calculate change in y divided by change in x, identify coefficients as rates, compare rates shown in different forms, classify positive, negative, and zero change, choose appropriate units, match rates with meanings, and correct common slope mistakes. Students also work with temperature change, real-world rate statements, and multiple-choice interpretations so they can move comfortably between calculations and explanations.
Teachers can use these pages throughout an 8th grade unit on slope, linear relationships, and functions. Some worksheets work well for introducing one specific skill, while others provide mixed review once students have experience with several representations. Parents, tutors, and homeschool educators can also use the activities to break rate of change into manageable steps, giving students repeated practice with calculation, signs, units, and contextual meaning before they move into more advanced linear equations and function comparisons.

Paul’s Teacher Tip
Have students write change in y ÷ change in x beside their work until the order becomes automatic. When a rate comes from a story, ask students to identify the two quantities first and then say the units aloud, because phrases such as “miles per hour” often reveal which value belongs on top and which belongs on the bottom. For negative rates, have students explain the direction of change before calculating so they connect the minus sign with decreasing output. When students compare representations, teach them to identify the form first-equation, table, or ordered pairs-and then choose the appropriate strategy for finding the rate. A helpful extension is to give students one rate and ask them to create a matching equation, table, and real-world situation.
Worksheet Collection Skill Spotlights
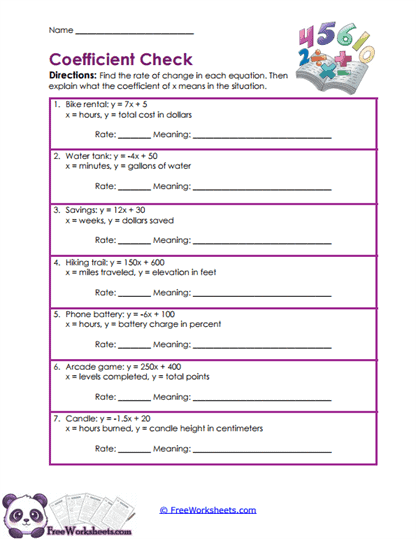
Coefficient Clues
What Kids Do:
Students examine seven linear equations connected to bike rentals, draining water, savings, hiking elevation, phone battery life, arcade points, and candle height. They locate the coefficient attached to x, identify it as the rate of change, and then explain what that positive or negative value means within the situation.
Target Skill:
Students strengthen their understanding that the coefficient of x in an equation such as y = mx + b represents the rate of change. The activity helps them separate slope from the initial value while interpreting signs, quantities, and units in ways that support 8th grade linear-function modeling.
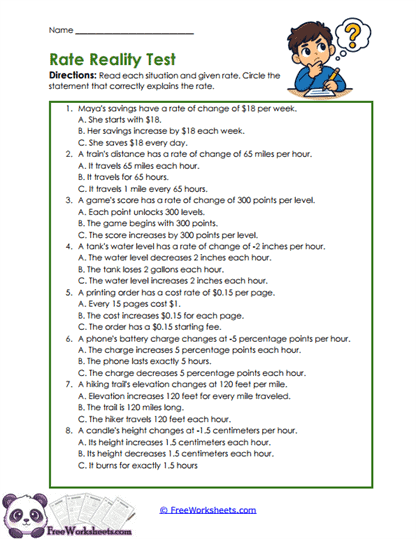
Context Check
What Kids Do:
Students answer eight multiple-choice questions built around savings, driving, game scores, water levels, printing costs, battery charge, hiking elevation, and changing height. For each problem, they compare three statements and choose the one that correctly matches the numerical rate, its sign, its units, and the situation being described.
Target Skill:
This activity develops careful contextual interpretation of slope by requiring students to distinguish correct rate statements from believable distractors. Students practice recognizing increases and decreases, keeping units in the proper order, and separating a rate of change from unrelated starting values or totals.
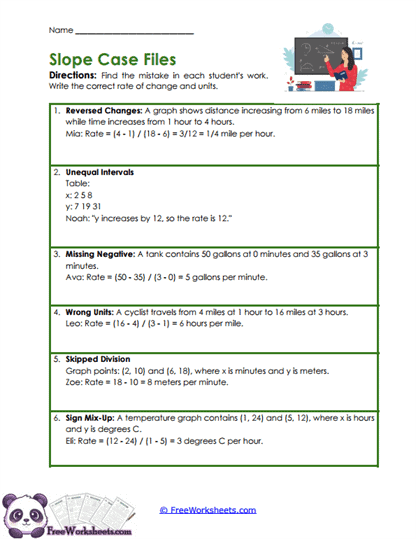
Error Detectives
What Kids Do:
Students investigate six examples of incorrect rate-of-change work and determine exactly where each solution went wrong. The errors include reversed subtraction, inconsistent coordinate order, unequal intervals, missing negative signs, skipped division, and incorrect units, giving students a chance to repair both the calculation and the final interpretation.
Target Skill:
Students build stronger slope reasoning by analyzing mistakes instead of simply completing another set of routine calculations. They reinforce change in y over change in x, consistent subtraction order, sign accuracy, division, and unit placement while developing the 8th grade habit of checking mathematical reasoning.
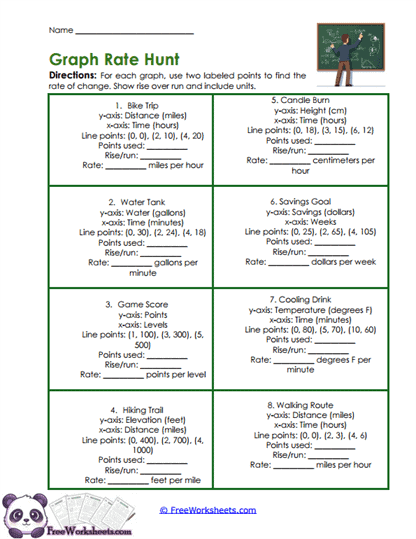
Graph Slopes
What Kids Do:
Students work with eight real-world linear situations represented by points from a graph or line, including travel, water levels, game scores, hiking, candles, savings, cooling drinks, and walking routes. They select two points, calculate rise and run, divide the changes, and write each rate with meaningful real-world units.
Target Skill:
The worksheet strengthens students’ ability to calculate slope from coordinate information and connect rise over run with change in y over change in x. Students also interpret the resulting rate with units, supporting 8th grade understanding of how graphical steepness represents real-world change.
Meaning Match
What Kids Do:
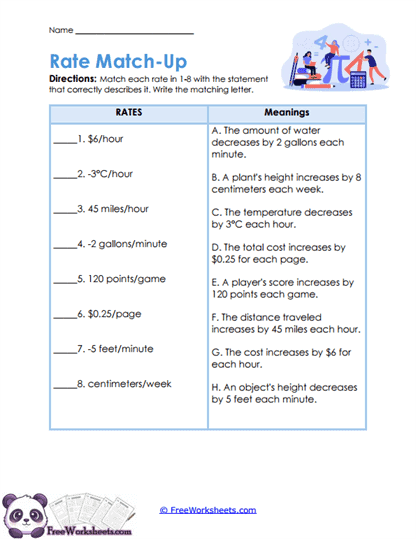
Students match eight numerical rates with statements that correctly explain their real-world meanings. They work with dollars per hour, degrees per hour, miles per hour, gallons per minute, points per game, dollars per page, feet per minute, and centimeters per week while using both signs and units to guide each match.
Target Skill:
Students develop fluency translating mathematical rates into everyday language. They learn to treat the numerical value, positive or negative sign, and measurement units as equally important parts of the rate, strengthening their ability to explain slope clearly in 8th grade linear situations.
Rate Battle
What Kids Do:
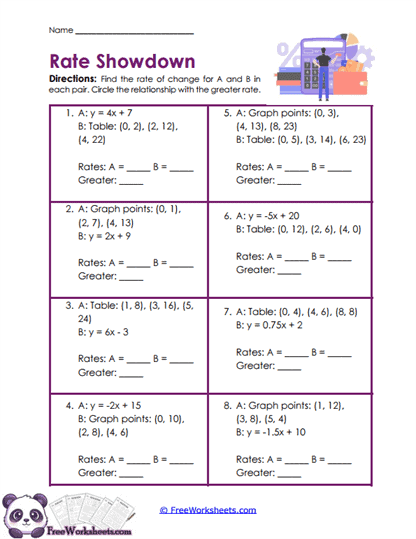
Students compare pairs of linear relationships presented as equations, tables, or coordinate points. They determine the rate of change for each representation using the correct method, then compare the two values to decide which relationship has the greater slope, including examples with positive, negative, fractional, and whole-number rates.
Target Skill:
This mixed-representation activity strengthens students’ ability to recognize and calculate slope regardless of how a relationship is displayed. Students practice reading rates directly from equations, calculating them from tables or points, and accurately comparing signed values in support of 8th grade function-comparison goals.
Rate Meaning
What Kids Do:
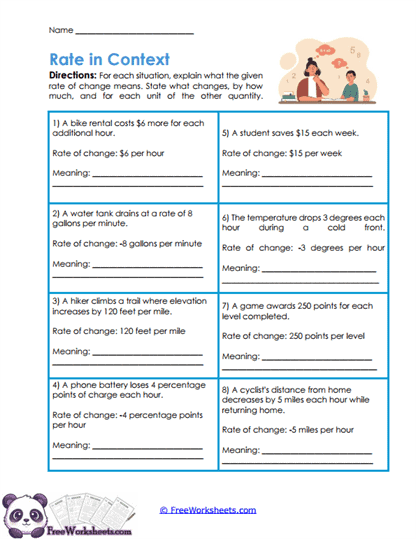
Students read eight everyday situations involving bike rentals, water tanks, hiking trails, phone batteries, savings, temperature, game points, and cycling distance. A numerical rate is already provided, so students focus on writing a complete statement that explains what changes, whether it increases or decreases, and how much it changes each time.
Target Skill:
Students strengthen contextual interpretation by turning rates such as dollars per hour or gallons per minute into meaningful sentences. The activity emphasizes direction, magnitude, and units, helping students understand slope as a description of real change rather than a number that exists only inside a calculation.
Rate Rescue
What Kids Do:
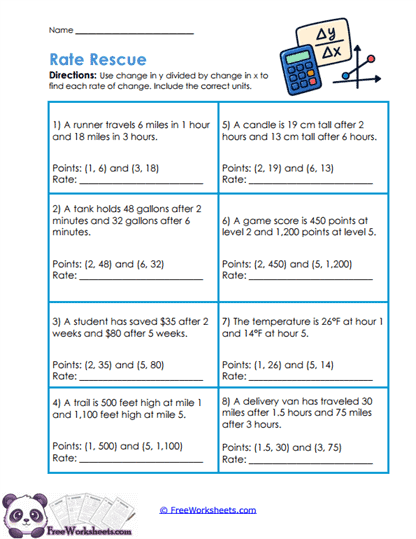
Students use two ordered pairs from eight real-world situations to calculate rates of change. They find the change in the second coordinates, find the corresponding change in the first coordinates, divide those values in a consistent order, simplify when necessary, and label each result with the correct units from the story.
Target Skill:
This worksheet builds dependable use of the slope formula with two points while reinforcing coordinate order and unit interpretation. Students practice recognizing how differences in y compare with differences in x, preparing them for 8th grade work with graphs, equations, tables, and linear models.
Sign Sorting
What Kids Do:
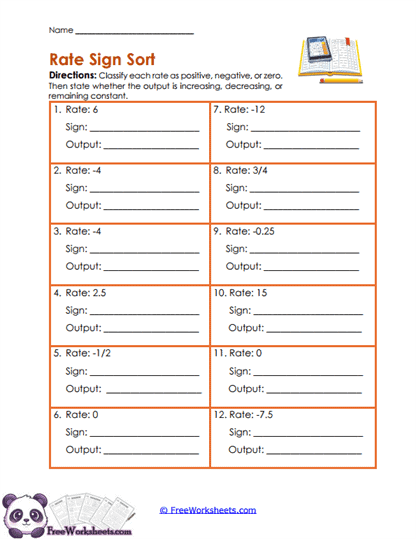
Students classify twelve rates written as integers, fractions, decimals, and zero. For every value, they decide whether the rate is positive, negative, or zero and then state whether the corresponding output would be increasing, decreasing, or staying constant as the input increases.
Target Skill:
Students develop a quick conceptual connection between the sign of a slope and the direction of a linear relationship. They learn that positive rates indicate increasing output, negative rates indicate decreasing output, and zero rates indicate constant output regardless of whether the rate is written as a whole number, fraction, or decimal.
Table Rates
What Kids Do:
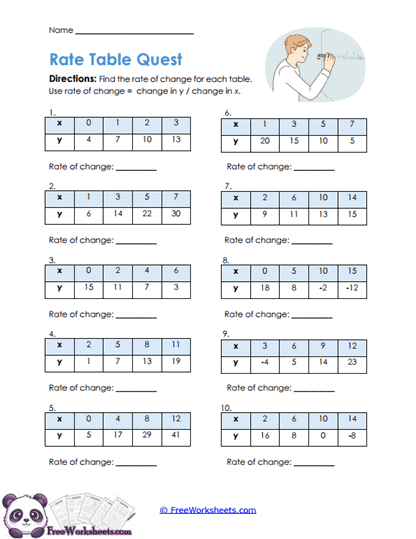
Students examine ten x-and-y tables and determine how each row of values changes from one ordered pair to the next. They calculate the change in y, compare it with the corresponding change in x, divide to find the constant rate, and use additional values in each table to check that the same relationship continues.
Target Skill:
The activity strengthens students’ ability to identify slope from tabular data instead of relying only on equations or graphs. Students practice recognizing constant change, working with positive and negative differences, and correctly applying change in y divided by change in x to support 8th grade linear reasoning.
Temperature Paths
What Kids Do:
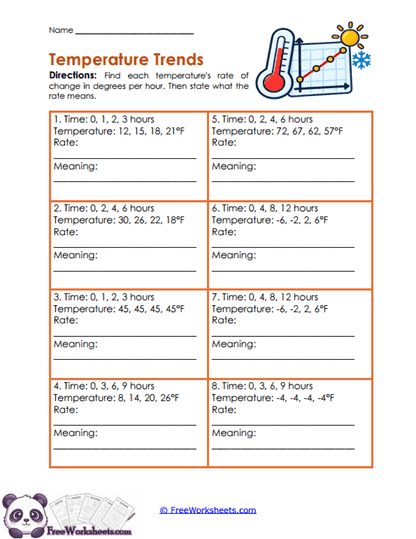
Students analyze eight sets of time and temperature values and calculate how many degrees the temperature changes per hour. They work with warming and cooling situations, account for different time intervals, determine positive or negative rates, and then explain what each result means in ordinary language.
Target Skill:
Students apply rate-of-change reasoning to a familiar measurement context while strengthening integer subtraction, division, sign interpretation, and unit analysis. The activity reinforces that a rate compares temperature change with elapsed time and helps students connect positive and negative slope with warming and cooling patterns.
Unit Sense
What Kids Do:
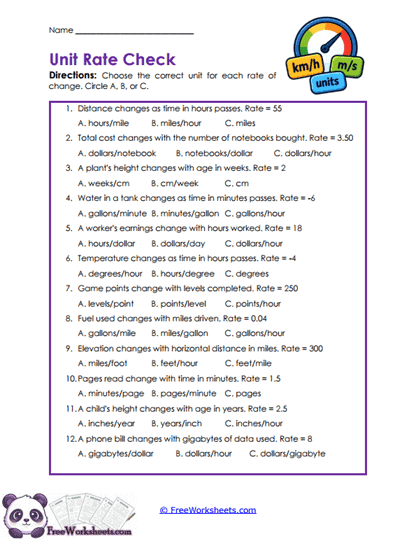
Students read twelve situations describing relationships involving distance, cost, growth, water, earnings, temperature, game points, fuel, elevation, reading speed, child growth, and phone billing. They choose the unit expression that correctly represents each given rate, paying close attention to which quantity belongs before and after the word “per.”
Target Skill:
This worksheet strengthens students’ understanding that units explain what a rate actually measures. Students practice distinguishing pairs such as miles per hour from hours per mile and learn to use numerator and denominator units as a built-in check when interpreting 8th grade rates of change.