
Analyzing Linear Equations Worksheets
8th grade math analyzing linear equations worksheets help students identify slope, interpret intercepts, compare equations, and connect equations with tables, graphs, and situations. Free, ready-to-print worksheets in PDF format are designed for immediate classroom use, centers, guided practice, homework, or homeschool lessons. Students strengthen linear-function reasoning, equation interpretation, and rate-of-change analysis while developing skills that support curriculum expectations.
About This Collection of Worksheets
Analyzing linear equations helps 8th grade students understand what slope-intercept form reveals about a relationship before they even draw the graph. Students learn how the coefficient of x represents slope, how the constant term represents the y-intercept, and how those two features describe a line’s direction, rate of change, and starting value.
The collection includes slope and intercept identification, increasing and decreasing relationships, real-world rate interpretation, starting values, table matching, graph clues, line comparisons, missing equation parts, error analysis, equation selection, game-based models, and story matching. Some worksheets focus on reading equations directly, while others ask students to compare representations or explain what slope and intercept mean in context.
Teachers can use these worksheets for direct instruction, guided math, centers, homework, intervention, review, or assessment preparation. Parents, tutors, and homeschool educators can begin with slope and intercept identification before moving into graph interpretation, function comparison, and modeling. The collection aligns especially well with CCSS.MATH.CONTENT.8.F.B.4, CCSS.MATH.CONTENT.8.F.A.2, and CCSS.MATH.CONTENT.8.EE.B.6.

Paul’s Teacher Tip
Have students separate slope from y-intercept before asking them to interpret an equation. A simple routine is to underline the coefficient of x and circle the constant term so the two roles stay distinct. When slope is negative, ask students what quantity is actually decreasing instead of accepting “the slope is negative” as a complete explanation. For real-world problems, require units with both rate of change and starting value. When comparing two equations, remind students to compare slopes for rate questions and intercepts for starting-value questions.
Worksheet Collection Skill Spotlights
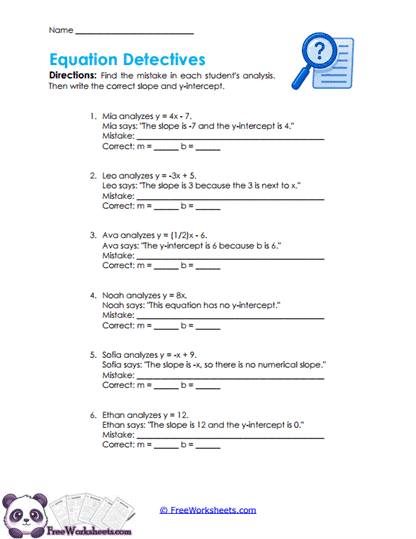
Equation Errors
What Kids Do: Students inspect incorrect analyses of linear equations and determine whether the slope, y-intercept, sign, or hidden zero value has been identified incorrectly. They explain the mistake and then record the correct values of m and b.
Target Skill: This activity develops careful reading of slope-intercept form and error analysis. 8th grade students practice distinguishing coefficients from constants, preserving negative signs, and recognizing that a missing x-term or constant term often represents a value of zero rather than nothing.
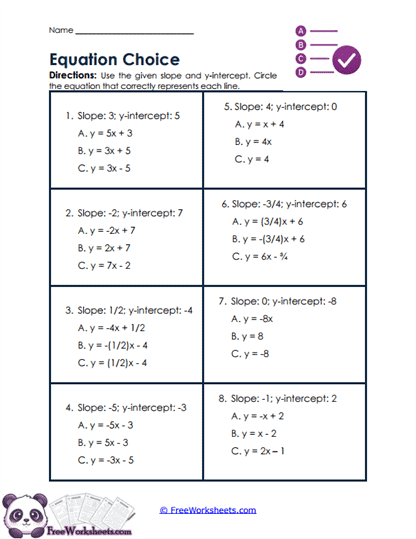
Equation Selection
What Kids Do: Students are given values for slope and y-intercept and choose the equation that correctly represents those features. They compare several answer choices involving positive, negative, fractional, and zero values before selecting the correct slope-intercept form.
Target Skill: This worksheet strengthens equation construction from known linear features. 8th grade students practice placing the slope with x, placing the initial value as the constant term, and preserving signs accurately when building or recognizing equations in the form y = mx + b.
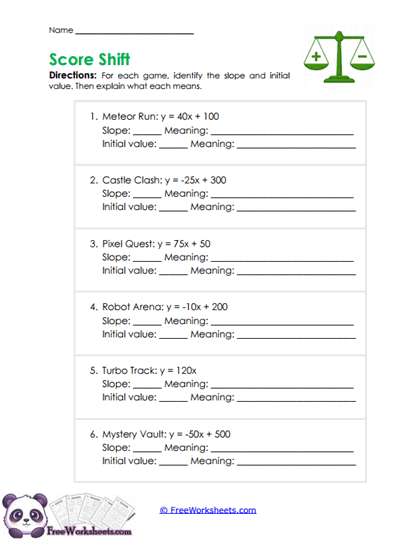
Game Models
What Kids Do: Students analyze game-based equations involving points, bonuses, penalties, rounds, and starting scores. They identify both the slope and y-intercept and explain how the score changes over time or repeated actions.
Target Skill: This activity develops contextual interpretation of both rate of change and initial value. 8th grade students learn to describe a complete linear model by explaining what quantity changes each time x increases and what value is already present when x begins at zero.
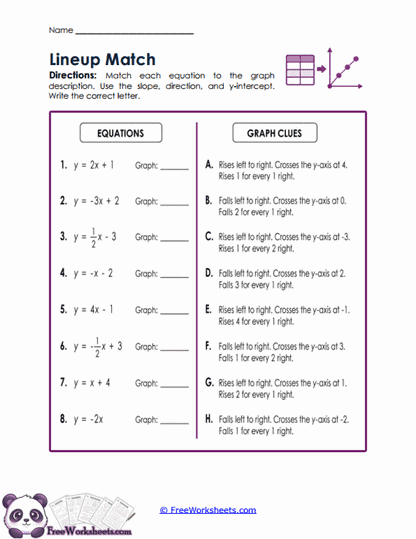
Graph Clues
What Kids Do: Students match linear equations with verbal descriptions of their graphs. They use the sign and size of the slope to determine rise, fall, or steepness and use the y-intercept to determine where the line crosses the vertical axis.
Target Skill: This worksheet strengthens mental connections between symbolic and graphical representations. 8th grade students practice predicting how a graph behaves from its equation and learn to use both slope and intercept together when identifying a line.
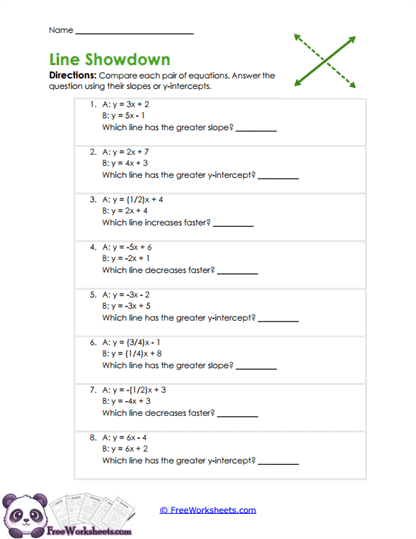
Line Comparisons
What Kids Do: Students compare pairs of linear equations and decide which one has the greater slope, larger y-intercept, faster increase, or faster decrease. They analyze positive, negative, fractional, and equal-value cases without needing to graph every line.
Target Skill: This activity develops efficient comparison of linear functions from equations. 8th grade students practice separating rate of change from starting value and learn that two equations can share one feature while differing in another.
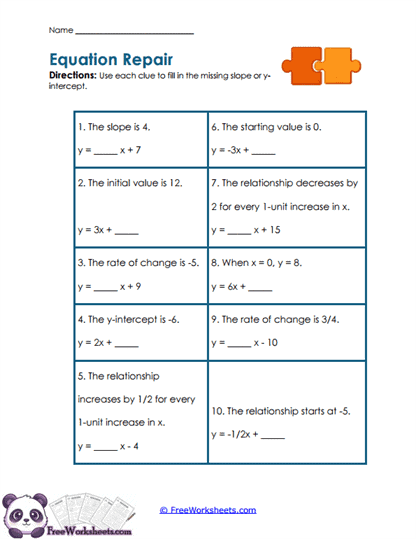
Missing Parts
What Kids Do: Students read verbal clues describing a rate of change or starting value and fill in the missing slope or y-intercept in a linear equation. They interpret phrases such as “decreases by,” “initial value,” and “when x equals zero.”
Target Skill: This worksheet develops translation from words into slope-intercept form. 8th grade students practice deciding whether a clue describes change or a starting point and then place that signed value in the correct location within the equation.
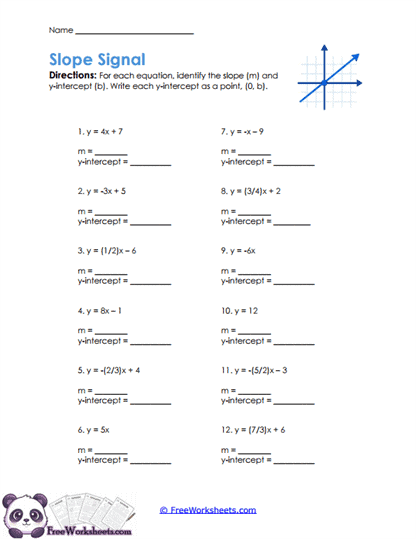
Slope Signals
What Kids Do: Students examine linear equations and identify the slope and y-intercept directly from slope-intercept form. They work with positive and negative slopes, fractions, zero slopes, and equations in which the y-intercept is zero.
Target Skill: This activity develops foundational fluency with the structure of y = mx + b. 8th grade students learn to read the coefficient of x as the rate of change and the constant term as the initial value without needing to graph first.
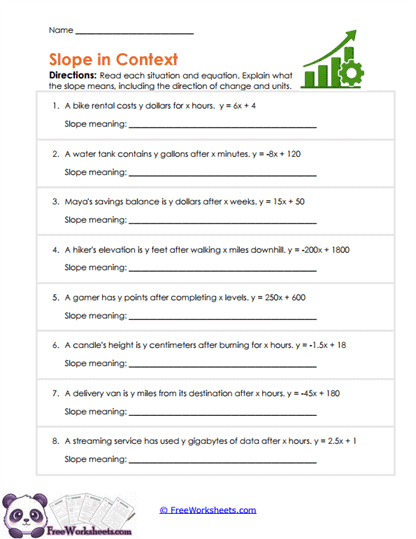
Slope Stories
What Kids Do: Students interpret slope in real-world equations involving costs, savings, elevation, game points, candle height, travel, and data use. They identify the rate and explain whether the related quantity increases or decreases for each unit of x.
Target Skill: This worksheet develops contextual meaning for slope. 8th grade students practice expressing rate of change with correct units and direction so values such as positive or negative slopes describe what is actually happening in a modeled situation.
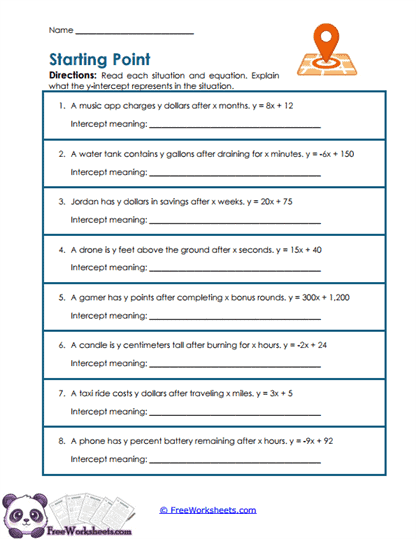
Starting Values
What Kids Do: Students identify the y-intercept in real-world linear equations and explain what it represents before any change occurs. Situations involve fees, water levels, savings balances, heights, scores, taxi costs, and battery levels.
Target Skill: This activity develops interpretation of the initial value in linear models. 8th grade students learn to connect the constant term with the amount present when x equals zero and distinguish that starting quantity from the rate of change.
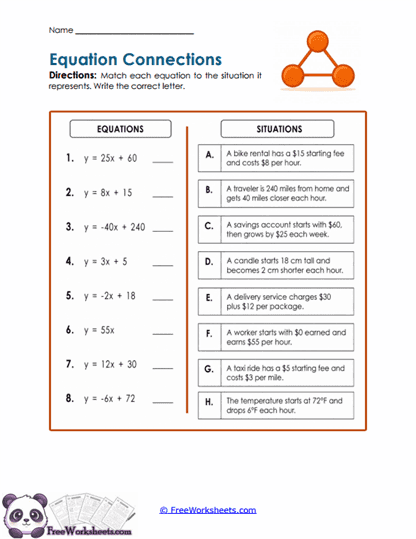
Story Equations
What Kids Do: Students match linear equations with real-world situations involving rentals, distance, savings, growth, delivery fees, wages, transportation, and temperature. They compare both the rate and starting amount to find the best match.
Target Skill: This worksheet strengthens algebraic modeling from verbal situations. 8th grade students practice reading equations as complete stories in which slope describes constant change and the y-intercept describes the initial condition.
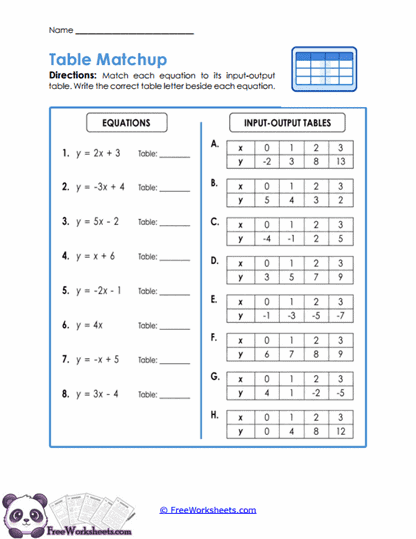
Table Matches
What Kids Do: Students compare linear equations with input-output tables and determine which table follows each rule. They use substitution, changing y-values, and the value where x equals zero to verify that the equation and table represent the same relationship.
Target Skill: This activity develops connections between symbolic and numerical representations of functions. 8th grade students practice using slope and initial value to recognize the same linear relationship across equations and tables.
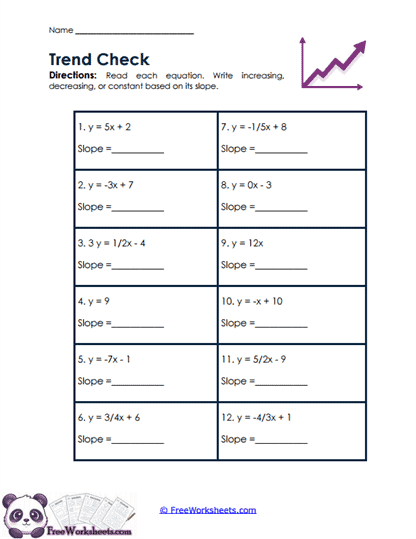
Trend Directions
What Kids Do: Students identify the slope in each linear equation and classify the relationship as increasing, decreasing, or constant. They work with positive slopes, negative slopes, fractions, and zero-slope equations.
Target Skill: This worksheet develops quick interpretation of line behavior from the sign of the slope. 8th grade students learn that positive rates rise from left to right, negative rates fall, and zero rates produce constant horizontal relationships.