
Applying Functions To Real Contexts Worksheets
8th grade math applying functions to real contexts worksheets help students connect function rules, equations, tables, graphs, and variables with everyday situations. Free, ready-to-print worksheets in PDF format are designed for immediate classroom use, independent practice, homework, intervention, or homeschool lessons. Students strengthen function interpretation, linear modeling, and rate-of-change reasoning while building skills that support 8th grade curriculum expectations.
About This Collection of Worksheets
Applying functions to real contexts helps 8th grade students understand why function rules, tables, equations, and graphs matter beyond the math classroom. Instead of treating inputs, outputs, rates, and initial values as separate ideas, students see how these pieces work together to describe situations involving money, distance, time, scoring, water levels, battery life, travel, and other familiar quantities. This makes function concepts easier to understand because every number has a purpose within a meaningful relationship.
The collection gives students several ways to work with real-world functions. Activities include identifying independent and dependent variables, deciding whether relationships are functions, completing input-output tables, evaluating function values, interpreting rates and starting values, writing linear equations, matching equations with situations, connecting stories with graph behavior, and correcting common interpretation mistakes. Students move between words, numbers, tables, equations, and graph descriptions so they become more comfortable recognizing the same mathematical relationship in different forms.
Teachers can use these worksheets throughout an 8th grade functions unit rather than saving them only for review. Individual pages work well for direct instruction, guided practice, partner conversations, math centers, homework, intervention, or short formative assessments. Parents, tutors, and homeschool educators can also use the collection to give students focused practice with one skill at a time while continually connecting the mathematics to situations students can picture and explain.

Paul’s Teacher Tip
When introducing these activities, have students identify what each variable actually represents before they perform any calculations. For linear situations, ask them to mark the starting amount and the amount that changes each time so they can clearly separate the initial value from the rate of change. When students work with graphs, encourage them to describe each section aloud as increasing, decreasing, or staying constant before they choose a matching story. If a student confuses an input with an output, use the prompt, “Which quantity is chosen or changes first, and which quantity responds?” For additional challenge, have students take one completed situation and represent it a second way by creating a table, equation, graph description, or short real-world story.
Worksheet Collection Skill Spotlights
Equation Contexts
What Kids Do:
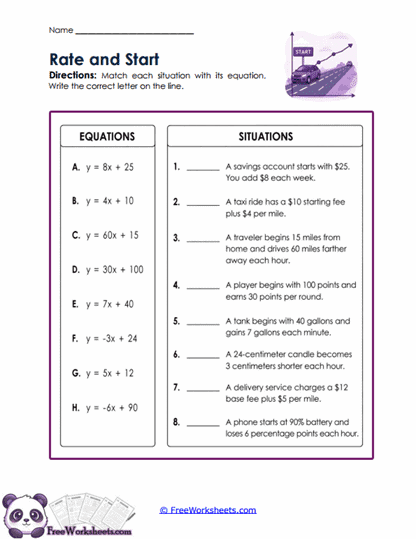
Students match eight linear equations with real-world situations involving savings, taxi fares, travel, game points, water levels, candle height, delivery charges, and battery percentage. They compare the starting amount and repeated change in each story with the slope and constant term shown in the available equations before recording the correct match.
Target Skill:
This activity strengthens students’ ability to interpret the structure of linear functions and connect symbolic equations with contextual meaning. Students practice distinguishing rates of change from initial values, recognizing positive and negative slopes, and selecting equations that accurately model 8th grade real-world relationships.
Equation Modeling
What Kids Do:
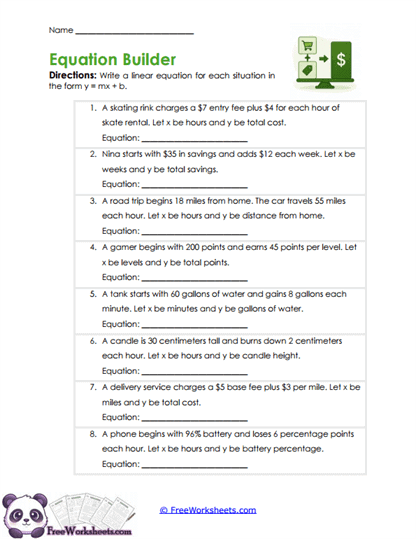
Students read eight situations involving skating costs, savings, travel distance, game scores, filling tanks, candle height, delivery charges, and battery life. They identify the starting value and constant rate in each story, determine whether the relationship increases or decreases, and write a matching equation in the form y = mx + b.
Target Skill:
Students develop the ability to construct linear functions directly from verbal descriptions. The work reinforces how the coefficient represents a rate of change and the constant represents an initial condition, helping students meet 8th grade curriculum goals for modeling relationships between two quantities with equations.
Function Corrections
What Kids Do:
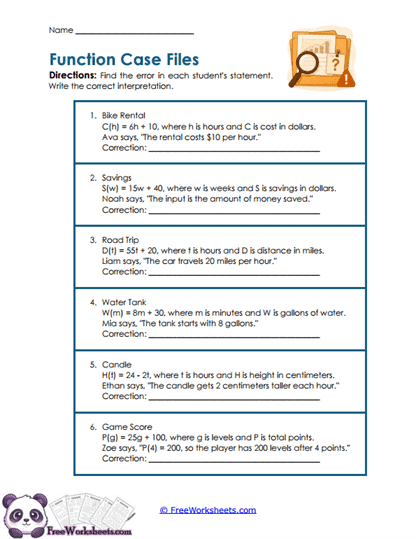
Students investigate six function “case files” containing an equation, variable meanings, and an incorrect student statement. They decide whether the mistake involves an input, output, rate, starting value, or increasing versus decreasing relationship, then write a corrected explanation that accurately describes the real-world function.
Target Skill:
This error-analysis format develops precise function vocabulary and deeper conceptual reasoning. Students must distinguish among inputs, outputs, rates, and initial values rather than relying only on calculation, strengthening their ability to explain and defend interpretations of 8th grade functions in context.
Function Rules
What Kids Do:
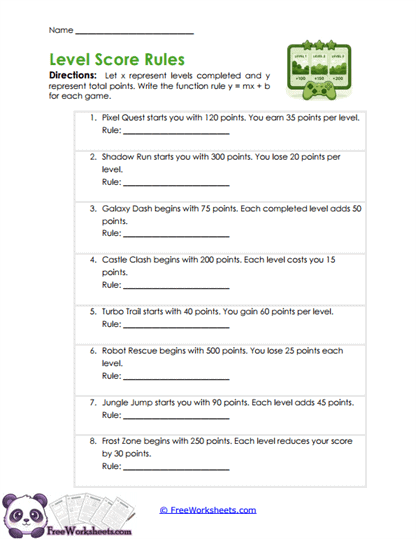
Students work through eight game-themed situations in which a score begins at a particular value and then increases or decreases by a constant number of points for every level completed. Using x for levels and y for total points, they identify the signed rate and starting score before writing a complete linear function rule.
Target Skill:
The activity builds fluency with translating verbal information into equations of the form y = mx + b. Students learn to place the repeated score change with the input variable and the starting score as the constant, reinforcing 8th grade linear modeling and the meaning of slope and initial value.
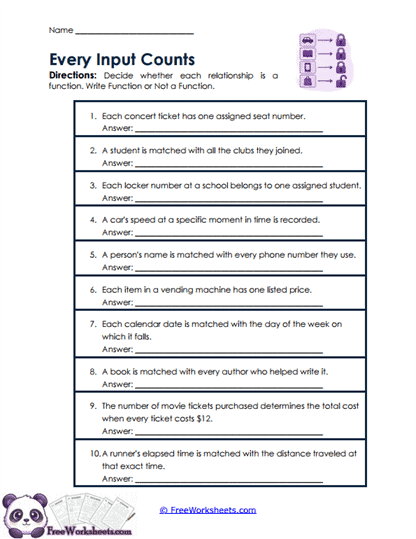
Function Tests
What Kids Do:
Students analyze ten everyday relationships involving tickets, club members, lockers, car speeds, names, vending machines, dates, books, movie costs, and running distance. For each situation, they decide whether every input is paired with exactly one output and record whether the relationship meets the definition of a function.
Target Skill:
Students strengthen their understanding of the defining property of a function: each input must have exactly one output. The activity also addresses the misconception that every output must be unique, helping students apply the 8th grade function definition to verbal situations instead of relying only on mappings or equations.
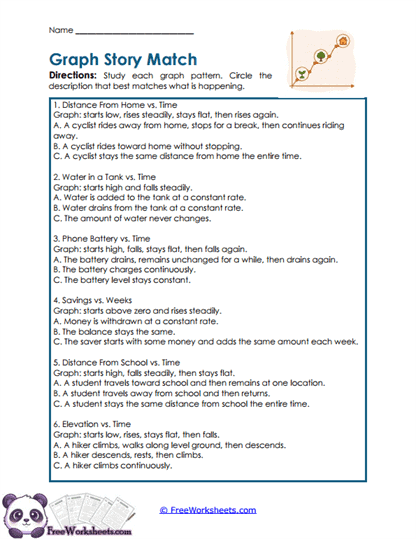
Graph Interpretations
What Kids Do:
Students read six descriptions of graph behavior involving distance, water level, battery charge, savings, location, and elevation. They compare patterns such as rising, falling, remaining flat, or changing direction with three possible real-world stories and select the interpretation that matches the entire sequence of the graph.
Target Skill:
This worksheet develops qualitative graph interpretation by asking students to connect increasing, decreasing, and constant intervals with events in a situation. Students learn that a graph tells a changing story over time, supporting 8th grade curriculum expectations for describing functional relationships from visual behavior.
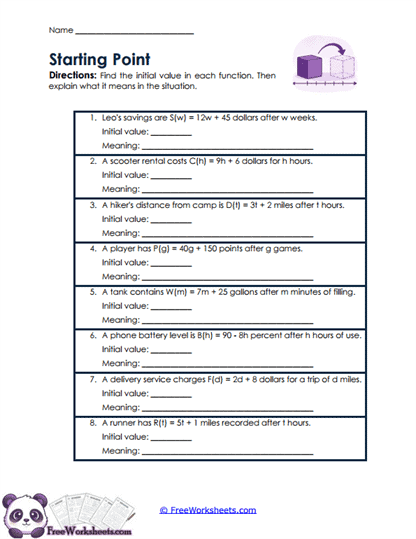
Initial Values
What Kids Do:
Students examine eight linear functions representing savings, scooter rentals, hiking distance, game scores, water tanks, phone batteries, delivery services, and running distance. They identify the constant term in each equation and then explain what that value represents when the input is zero in the real-world situation.
Target Skill:
Students build a clear understanding of the initial value as the output present before the repeated change begins. By connecting the constant term with starting savings, fees, distances, volumes, percentages, and scores, students strengthen 8th grade understanding of y-intercepts and starting conditions in linear models.
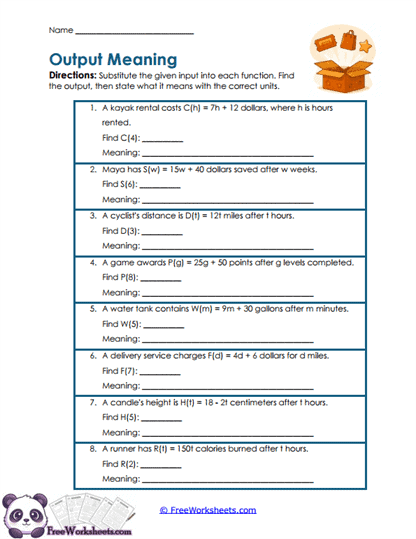
Output Interpretations
What Kids Do:
Students evaluate eight real-world functions by substituting a given input value, calculating the resulting output, and then explaining what that number means in the original situation. Contexts include kayak rentals, savings, cycling, game awards, water tanks, delivery charges, candle height, and calories burned.
Target Skill:
The worksheet strengthens function notation, substitution, arithmetic accuracy, and contextual interpretation at the same time. Students learn that an output is not simply a computed number but a quantity with a specific meaning and unit, supporting 8th grade understanding of how functions model real situations.
Output Tables
What Kids Do:
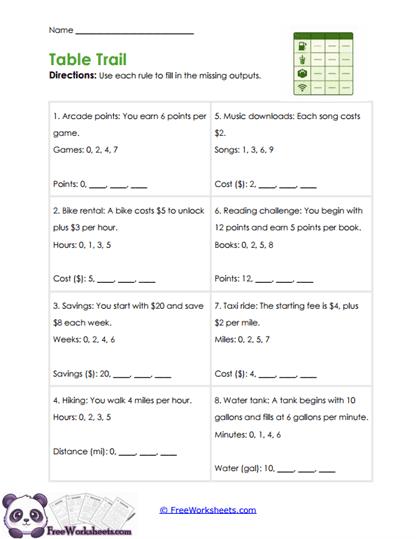
Students complete eight input-output tables using verbal rules about arcade points, bike rental costs, weekly savings, hiking distance, music downloads, reading points, taxi fares, and filling water tanks. They apply the stated rate and, when needed, add an initial amount to calculate each missing output for the listed inputs.
Target Skill:
Students practice using linear rules to generate ordered input-output values while distinguishing proportional relationships from functions that begin with a nonzero starting value. The activity develops 8th grade readiness for identifying rate of change, initial value, and the structure of equations such as y = mx + b.
Rate Interpretations
What Kids Do:
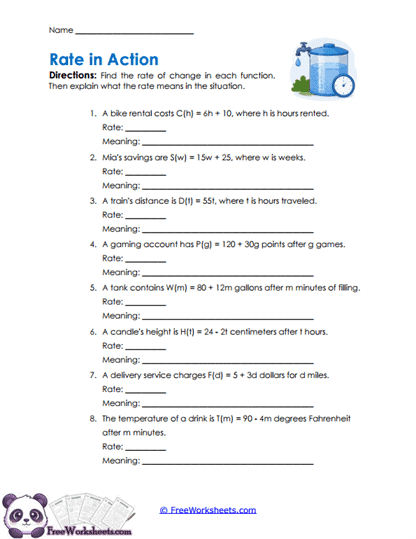
Students study eight linear functions connected to bike rentals, savings, train travel, game points, water tanks, candles, delivery costs, and cooling temperatures. They identify the coefficient of the input variable as the rate of change and write a contextual explanation using appropriate units such as dollars per hour or degrees per minute.
Target Skill:
Students strengthen their understanding of slope as a meaningful rate rather than just a number in an equation. They distinguish the rate from the initial value, interpret positive and negative changes, and attach correct units, directly supporting 8th grade curriculum expectations for interpreting linear functions in context.
Story Graphs
What Kids Do:
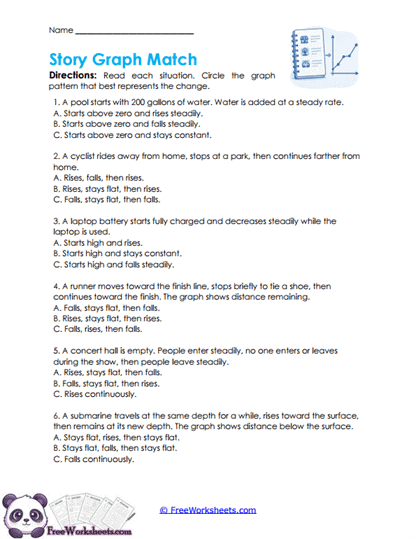
Students read six stories about a filling pool, cycling distance, laptop battery life, a runner’s progress, auditorium attendance, and submarine depth. They break each story into stages such as rising, falling, or remaining constant, then choose the graph description that follows those changes in the correct order.
Target Skill:
This activity strengthens students’ ability to translate verbal descriptions of change into qualitative graph behavior. By recognizing pauses, reversals, increases, and decreases, students develop the 8th grade skill of connecting real-world events with intervals and trends shown by functions on graphs.
Variable Connections
What Kids Do:
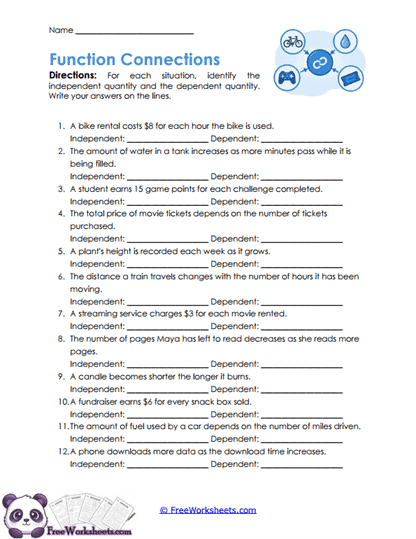
Students read twelve short situations involving bike rentals, tanks, scores, movie tickets, plant growth, train travel, streaming costs, reading progress, candles, fundraising, fuel use, and phone downloads. For each relationship, they identify the independent quantity and the dependent quantity and record each one in the proper place.
Target Skill:
Students strengthen their understanding of inputs and outputs by deciding which quantity can change first and which quantity changes in response. This cause-and-response reasoning gives students an important 8th grade foundation for function tables, equations, graphs, and later work with independent and dependent variables.