
About This Worksheet
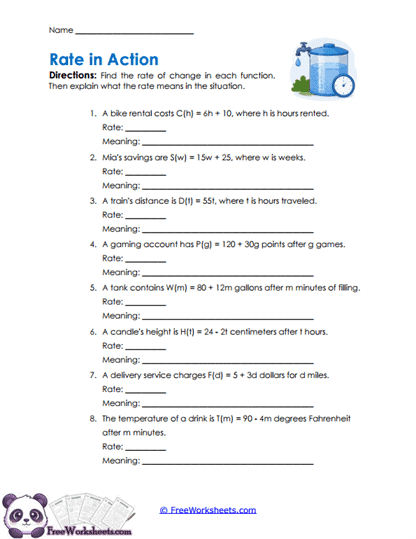
This Grade 8 worksheet helps students identify and interpret the rate of change in real-world linear functions. Students work with equations involving bike rentals, savings, train travel, game points, filling water tanks, candle height, delivery costs, and cooling temperatures. For each function, they determine the rate and then explain what that value means in the situation. The activity connects the coefficient of the input variable with real-world change, helping students understand that slope describes how one quantity changes as another increases.
Curriculum and Grade Alignment
This worksheet directly supports CCSS.MATH.CONTENT.8.F.B.4, which asks students to interpret the rate of change of a linear function in terms of the situation it models. Students identify both positive and negative rates and explain them using appropriate units. This is an important Grade 8 function skill because it connects symbolic equations with slope, real-world change, and later graph analysis.
Student Tasks
Students examine eight linear functions and identify the coefficient attached to the input variable. They record that number as the rate of change and then explain it in words, such as dollars per hour, dollars saved per week, miles traveled per hour, points earned per game, gallons added per minute, centimeters lost per hour, dollars charged per mile, or degrees cooled per minute. Students must interpret whether the quantity increases or decreases and include the correct units.
Common Challenges and Misconceptions
Students may confuse the rate of change with the initial value, especially when both numbers appear in the equation. Others may identify a negative rate but fail to explain that the quantity is decreasing. Some students also leave off units, which makes the rate incomplete. A helpful prompt is, “What changes every time the input increases by one?” This keeps their attention on the coefficient of the variable rather than the constant term.
Implementation Guidance
Have students underline the coefficient and circle the constant term before beginning the meaning statement. Then ask them to read the rate aloud using units, such as “six dollars per hour” or “two centimeters less per hour.” This worksheet works especially well after students have practiced identifying slope and before they compare rates across equations, tables, and graphs. It can be used for independent practice, homework, guided discussion, or intervention.
Details and Features
The page includes eight real-world linear functions with a line for the rate and a separate line for its meaning. The examples include positive and negative changes across money, distance, points, volume, height, cost, and temperature contexts. The structure keeps students focused on interpreting the rate instead of simply copying a coefficient.