
About This Worksheet
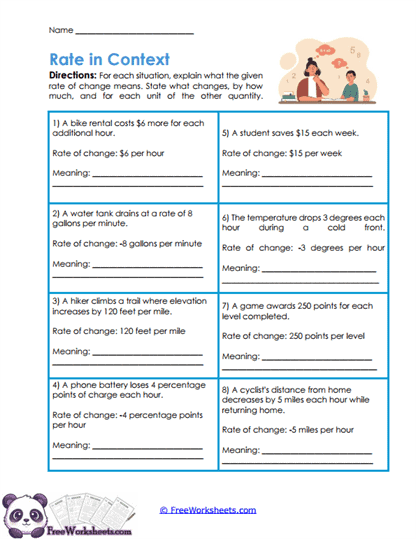
This worksheet moves beyond simply finding a number and asks students to explain what a rate of change actually means in a real situation. Students read eight short scenarios involving bike rentals, water tanks, hiking trails, phone batteries, savings, temperature, game points, and cycling distance. Each problem already gives the rate of change, so the main job is to put that rate into clear everyday words.
For example, a bike rental has a rate of change of $6 per hour. Students should explain that the rental cost increases by $6 for every additional hour the bike is rented. A water tank with a rate of -8 gallons per minute is losing 8 gallons each minute. These examples help students understand that the sign, number, and units all tell an important part of the story.
What Students Practice
Students practice translating mathematical rates into meaningful sentences. Rather than doing a long calculation, they must decide what quantity is changing, whether it is increasing or decreasing, and how that change relates to the second quantity. This makes students slow down and think about the meaning behind expressions such as “$15 per week” or “-3 degrees per hour.”
The activity also gives students practice working with positive and negative rates. Positive rates can describe things such as earning money or gaining elevation, while negative rates can describe draining water, falling temperatures, or decreasing distance. Seeing these examples side by side makes it easier for students to understand that a negative rate does not mean something is “wrong”; it simply tells us the quantity is going down.
Why This Skill Matters
Students often learn how to calculate slope before they fully understand what the answer represents. This worksheet helps close that gap. A rate of change becomes much more useful when a student can say, in plain language, what changes and how quickly it changes.
That skill matters far beyond one math lesson. Rates appear in speed, prices, savings, temperatures, water levels, battery life, distances, and many other everyday situations. When students can interpret a rate correctly, they are much better prepared for word problems and for explaining the meaning of slope in a linear model.
Common Challenges
A student may copy the given rate into the answer space without actually explaining it. Encourage them to use a complete idea such as, “The temperature falls 3 degrees each hour,” instead of simply writing “-3 degrees per hour.” The goal here is interpretation, not repetition.
Another common problem is ignoring the negative sign. A rate of -5 miles per hour means a distance is decreasing by 5 miles each hour, not increasing. It can help to have students circle the sign first and say either “increases” or “decreases” before they write the rest of the meaning.
How To Use It
This page is especially helpful after students have learned how to calculate rate of change and are ready to explain their answers. Teachers can use it as class practice, a small-group lesson, homework, or an exit activity to see whether students truly understand the meaning of a rate. Having students share a few answers aloud can also lead to useful conversations about units and positive versus negative change.
At home, a parent can make the activity very conversational. Ask, “What is changing here?” followed by, “Is it going up or going down?” and finally, “How much does it change each time?” Those three questions can guide a student through nearly every problem on the page without making the lesson feel overly technical.
Grade Alignment
This Grade 8 worksheet supports the interpretation of slope and rate of change in real-world situations. It connects with CCSS 8.F.B.4, which asks students to construct and interpret linear relationships between two quantities and explain the meaning of the rate of change and initial value. The worksheet gives particular attention to interpreting the rate in the context of the quantities being described.
Students should already understand basic rates and positive and negative numbers. The next step is to connect these verbal meanings to tables, graphs, and equations and explain how the same rate of change appears in each form.