
About This Worksheet
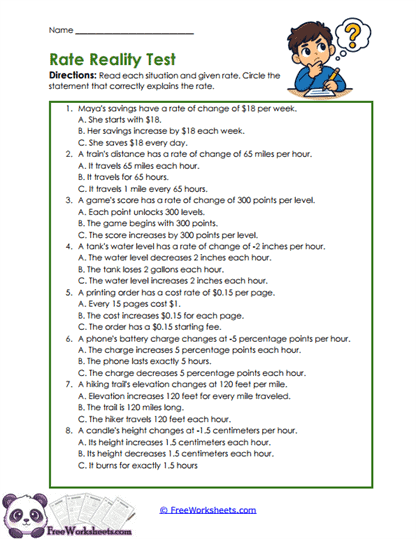
This worksheet asks eighth-grade students to decide which statement correctly interprets a given rate of change in a real-life situation. Each of the eight multiple-choice questions provides a short situation, a numerical rate, and three possible explanations. Students must choose the statement that matches the sign, size, and units of the rate. The examples include savings, driving, game scores, water levels, printing costs, battery charge, hiking elevation, and object height.
For example, if Maya’s savings have a rate of change of $18 per week, the correct interpretation is that her savings increase by $18 each week. A rate of -2 inches per hour for a water tank means the water level decreases by 2 inches every hour. These questions help students learn to read rates carefully instead of choosing an answer that only looks similar.
What Students Practice
Students practice interpreting positive and negative rates in complete real-world situations. They must identify what quantity is changing, whether it increases or decreases, and how much change occurs for each unit of the second quantity. The multiple-choice format also asks students to distinguish a correct interpretation from common misunderstandings.
Several distractors are designed to look reasonable at first glance. Some reverse the units, some confuse a starting value with a rate, and others ignore the negative sign. This gives students useful practice checking every part of a statement before deciding it is correct.
Why This Skill Matters
Knowing how to calculate a rate is only part of understanding linear relationships. Students also need to explain what that rate means in the situation. This becomes especially important when slope is used to describe speed, cost, growth, loss, temperature change, or other real-world patterns.
Strong interpretation skills also help students avoid careless mistakes. A student who understands that -5 percentage points per hour means a decrease is less likely to misread a graph or equation later. This worksheet gives students a practical way to connect numbers with meaning.
Common Challenges
Students may choose an answer because it uses the same number as the rate without checking the units. For example, 65 miles per hour does not mean a trip lasts 65 hours. Encourage students to read the full sentence and make sure both quantities are described correctly.
Negative rates are another common source of confusion. Students may see -1.5 centimeters per hour and still choose a statement saying height increases. Remind them that a negative rate means the output decreases as the input increases.
How To Use It
Teachers can use this worksheet as a review after students have practiced finding and explaining rates of change. It is useful for independent work, homework, small-group discussion, or a short assessment because each answer reveals whether students understand the meaning of the rate. Asking students to explain why the other two choices are wrong can make the activity even stronger.
Parents and homeschool teachers can use the answer choices as conversation starters. Ask the student to explain what is wrong with each incorrect option before selecting the best one. This helps build confidence and encourages careful reading rather than guessing.
Grade Alignment
This worksheet is written for Grade 8 math and supports interpretation of linear rates in context. It aligns closely with CCSS 8.F.B.4, which asks students to interpret the rate of change of a linear function in terms of the situation it models. The page also supports broader Grade 8 work with slope, units, and real-world linear relationships.
Students should already understand positive and negative numbers and basic rate language. After completing this activity, they are prepared to interpret rates in more complex tables, graphs, equations, and linear models.