
Binomial And Normal Distributions Worksheets
Binomial and normal distributions in 12th grade math help pre-calculus students model repeated events, interpret data, and calculate probabilities from structured distributions. These free, ready-to-print PDF worksheets are prepared for immediate classroom use, homework, review, tutoring, intervention, or independent probability practice. Students strengthen binomial modeling, z-score interpretation, cumulative probability, and normal-distribution reasoning while meeting key 12th grade curriculum goals.
About This Collection of Worksheets
Binomial and normal distributions give 12th grade students two important ways to describe probability and data. Binomial models focus on repeated independent trials with two possible outcomes and a constant probability of success, while normal models describe continuous data clustered around a mean. Students learn how to choose the appropriate model, identify its important values, calculate probabilities, and interpret what the results mean in context.
This collection develops those skills through a progression of conceptual, computational, and applied activities. Students identify binomial conditions, define distribution parameters, translate probability phrases, calculate exact and cumulative binomial probabilities, find means and standard deviations, use the 68-95-99.7 rule, calculate z-scores, shade normal-curve regions, find normal probabilities, work backward from percentiles, and apply distributions to quality-control settings. Together, the activities connect notation, formulas, graphs, technology, and real-world interpretation.
Teachers can use these worksheets throughout a 12th grade pre-calculus probability unit for direct instruction, guided practice, independent work, homework, review stations, intervention, or assessment preparation. Parents, tutors, and homeschool educators can also select individual pages based on whether a student needs support with binomial setup, cumulative probability, z-scores, normal curves, or inverse-normal reasoning. The sequence moves naturally from choosing and describing probability models to using those models in increasingly realistic applications.

Paul’s Teacher Tip
Before students calculate anything, have them identify which distribution they are working with and explain why that model fits. For binomial problems, make the four conditions visible: fixed trials, two outcomes, independence, and constant probability. For normal-distribution work, ask students to sketch and shade the desired region before using technology so they know whether they need the left tail, right tail, or middle. Require students to interpret every mean, standard deviation, z-score, or probability in the language of the problem rather than leaving it as an isolated number. When students use calculator functions, have them estimate whether the answer should be small, moderate, or large first so the technology serves as a check rather than a substitute for reasoning.
Worksheet Collection Skill Spotlights
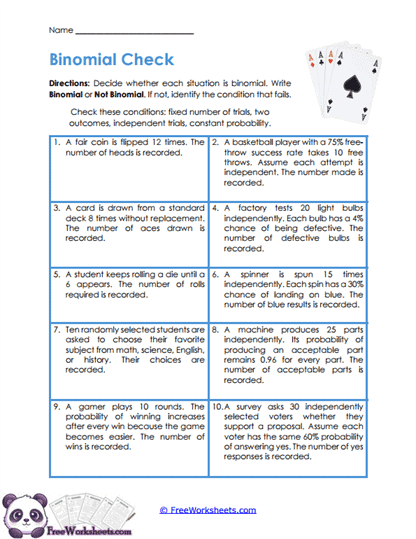
Binomial Decisions
What Kids Do:
Students read ten probability situations involving repeated events such as coin flips, free throws, surveys, games, testing, and quality checks. For each one, they determine whether the situation qualifies as binomial by checking the number of trials, possible outcomes, independence, and whether the probability of success remains constant.
Target Skill:
This activity develops model-selection reasoning before students ever use a binomial formula. Students learn to test all four defining conditions carefully and recognize when a changing probability, dependent trial, or unsuitable outcome structure makes a binomial distribution inappropriate.
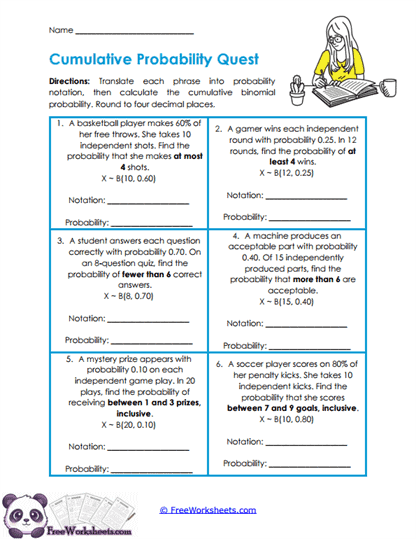
Cumulative Chances
What Kids Do:
Students calculate six binomial probabilities involving ranges of success counts rather than one exact outcome. They interpret phrases such as at most, at least, fewer than, more than, and between, list the outcomes included by the wording, and use cumulative methods or complements to determine the total probability.
Target Skill:
Students strengthen the connection between probability language and mathematical intervals of discrete outcomes. The worksheet reinforces inclusive and exclusive boundaries, cumulative probability, complement reasoning, and the 12th grade skill of translating verbal probability conditions accurately before calculating.
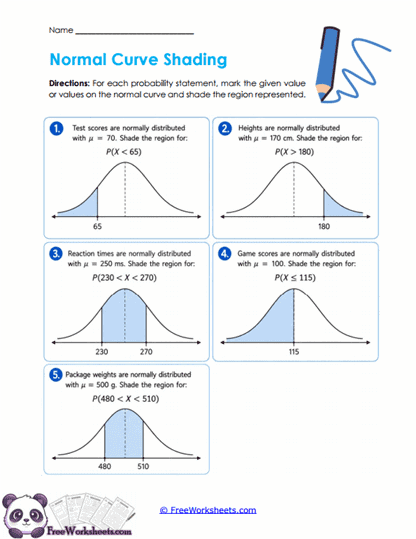
Curve Regions
What Kids Do:
Students work with five normal-curve diagrams by locating one or two cutoff values and shading the region described by a probability statement. They identify whether each problem represents a left-tail probability, right-tail probability, or area between two values before marking the correct section under the curve.
Target Skill:
This visual activity reinforces the idea that normal-distribution probabilities represent areas under a curve. Students develop stronger interpretation of inequalities, tails, and bounded regions while preparing to use calculator technology with a clear understanding of which probability is actually being measured.
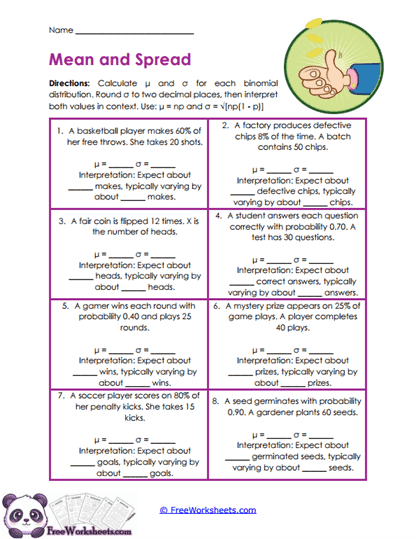
Distribution Center
What Kids Do:
Students analyze eight binomial situations and calculate the mean and standard deviation for each distribution. They use the trial count, success probability, and failure probability to find the numerical values, then explain what the expected number of successes and typical variation mean in the original context.
Target Skill:
Students develop an understanding of center and spread within binomial models. The worksheet reinforces expected value, standard deviation, contextual interpretation, and the connection between binomial distributions and later normal-distribution work using the same statistical ideas.
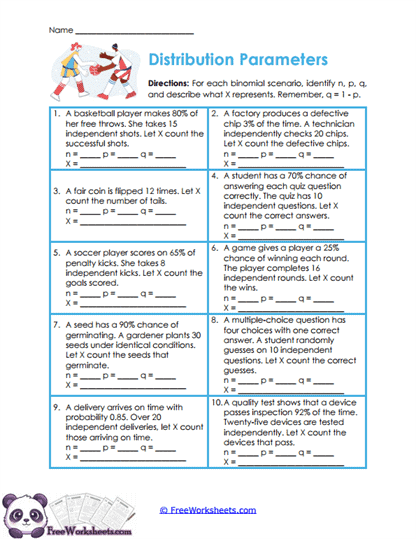
Distribution Details
What Kids Do:
Students examine ten real-world binomial situations and identify the number of trials, probability of success, probability of failure, and meaning of the random variable. They determine what counts as success and explain what quantity is actually being counted in each experiment.
Target Skill:
This worksheet builds accurate setup skills for binomial probability models. Students learn to separate trial count from success count, distinguish success probability from failure probability, and interpret the random variable as a number of successes rather than as a probability itself.
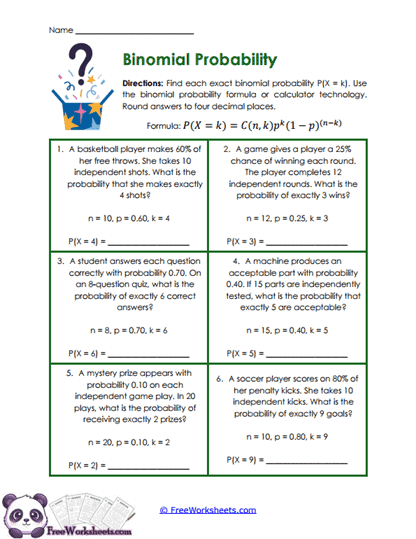
Exact Binomial
What Kids Do:
Students solve six probability problems that ask for exactly one specified number of successes. They identify the total trials, success probability, failure probability, and requested success count before substituting those values into the binomial probability formula and rounding the final result appropriately.
Target Skill:
Students build fluency with exact binomial probability by combining combinations, powers, and probability values correctly. The activity reinforces the distinction between one exact outcome and a cumulative range while preparing students for broader discrete-distribution calculations.
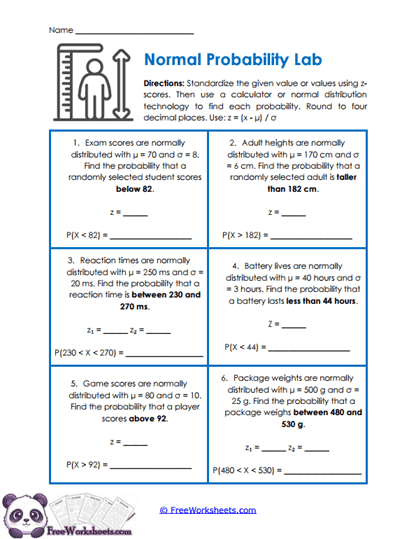
Normal Probability
What Kids Do:
Students solve six normal-distribution problems involving scores, heights, reaction times, battery life, game results, and package weights. They standardize one or two raw values with z-scores and then use normal-distribution technology to find probabilities below, above, or between the stated boundaries.
Target Skill:
This activity connects standardization with area under a normal curve. Students reinforce z-score calculation, tail selection, two-boundary setup, calculator use, and interpretation of probabilities within realistic 12th grade pre-calculus contexts.
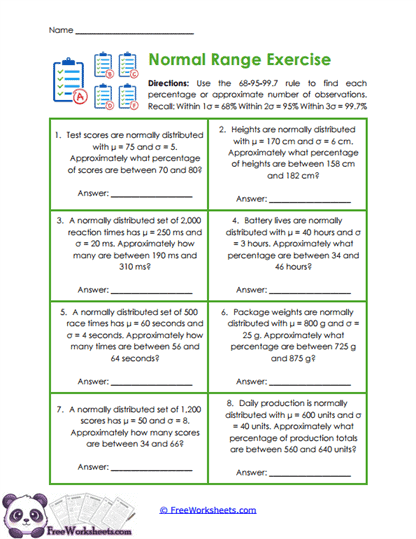
Normal Ranges
What Kids Do:
Students use eight normal-distribution situations to identify intervals located one, two, or three standard deviations from the mean. They compare each boundary with the mean and apply the 68-95-99.7 rule to estimate the percentage of observations contained within the specified range.
Target Skill:
Students develop intuitive understanding of how normal data cluster around the mean. The worksheet reinforces standard deviation as a measure of spread, empirical-rule percentages, symmetric intervals, and reasonable estimation before more exact normal-probability calculations are introduced.
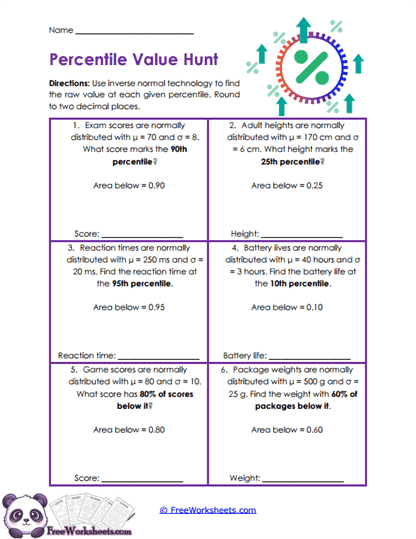
Percentile Search
What Kids Do:
Students work backward through six normal-distribution problems in which a percentile or cumulative area is given instead of a raw value. They interpret the percentile as an area to the left, use inverse-normal technology, and convert the resulting standardized position into the original score, height, time, or measurement.
Target Skill:
This worksheet develops inverse normal reasoning by reversing the usual value-to-probability process. Students strengthen percentile interpretation, cumulative area, technology use, and the ability to report final results in the original units of the distribution rather than stopping with a z-score.
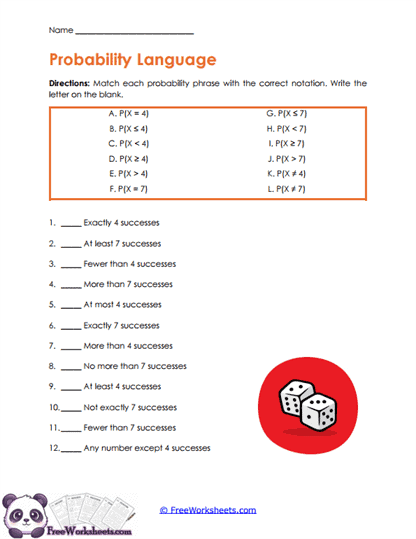
Probability Phrases
What Kids Do:
Students match twelve verbal probability statements with symbolic notation. They work with phrases such as exactly, at least, at most, more than, fewer than, no more than, and not exactly, paying careful attention to whether boundary values are included or excluded.
Target Skill:
Students strengthen the language skills needed for accurate probability setup. The activity reinforces equality and inequality notation, inclusive versus exclusive boundaries, and the ability to recognize whether a probability statement refers to one outcome or an entire range of possible outcomes.
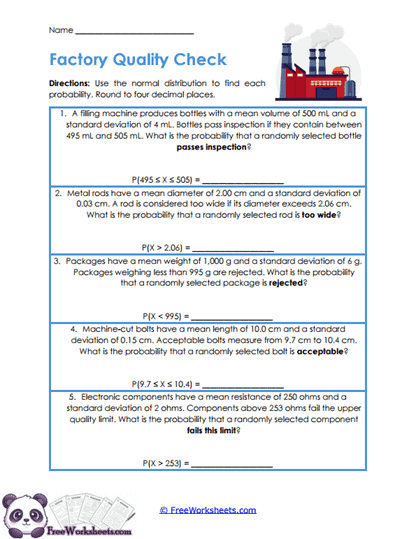
Quality Limits
What Kids Do:
Students solve five manufacturing and quality-control problems involving bottle fills, rod diameters, package weights, bolt lengths, and electronic resistance. They identify acceptable or rejected regions, standardize one or two cutoff values, and calculate the probability that a randomly selected item passes, fails, or falls inside tolerance limits.
Target Skill:
Students apply normal-distribution reasoning to realistic production settings. The worksheet reinforces one-sided and two-sided probability regions, quality tolerances, z-scores, probability interpretation, and the practical role of statistical models in estimating pass and rejection rates.
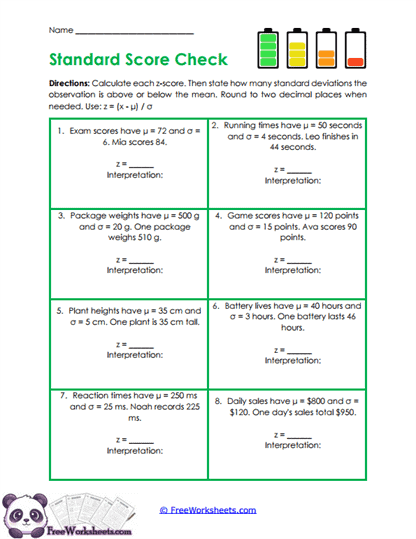
Standard Scores
What Kids Do:
Students calculate z-scores for eight observations drawn from different normal distributions. They subtract the mean from each observed value, divide by the standard deviation, and then explain whether the observation lies above or below the mean and by how many standard deviations.
Target Skill:
This activity develops fluency with standardization and contextual interpretation. Students learn to compare values from different distributions on a common scale while reinforcing positive and negative z-scores, distance from the mean, and the foundation needed for later normal probability and percentile work.