
Probability Distributions Worksheets
Probability distributions in 12th grade math help pre-calculus students organize possible outcomes, measure likelihood, and describe the center and spread of random results. These free, ready-to-print PDF worksheets are designed for immediate classroom use, homework, review, tutoring, intervention, or independent probability practice. Students strengthen random-variable classification, expected-value reasoning, probability-table analysis, and distribution comparisons while developing skills expected throughout the 12th grade curriculum.
About This Collection of Worksheets
Probability distributions give 12th grade students a structured way to connect possible numerical outcomes with the likelihood of each one. Students begin by identifying random variables and distinguishing discrete counts from continuous measurements, then learn how to build and validate probability tables. From there, they use distributions to calculate probabilities, expected values, means, standard deviations, and other measures that describe how outcomes behave over repeated trials.
This collection develops those ideas through several different activity types. Students identify random variables, classify discrete and continuous data, construct distributions, audit probability tables, solve for missing probabilities, translate probability language, look up event probabilities, calculate expected values, find distribution spread, match tables with histograms, compare distributions, and evaluate the fairness of games. These activities connect numerical tables, notation, graphs, long-run averages, and real-world interpretation.
Teachers can use these worksheets throughout a 12th grade pre-calculus probability unit for direct instruction, guided practice, independent work, homework, intervention, review stations, or assessment preparation. Parents, tutors, and homeschool educators can also choose individual pages to target random variables, probability notation, expected value, standard deviation, or distribution comparison. The sequence moves naturally from understanding what a distribution represents to using it for analysis and decision-making.
Paul’s Teacher Tip
Before students calculate anything from a probability distribution, have them explain what the random variable actually represents in words. Encourage them to check every table with two quick questions: Are all probabilities between 0 and 1, and do they add to 1? When introducing expected value, remind students that the result is a long-run average and does not need to be one of the possible outcomes. Keep mean and standard deviation clearly separated by describing one as the center and the other as the spread. For game problems, have students mark losses as negative values before multiplying by probabilities so the expected-value calculation reflects the situation correctly.
Worksheet Collection Skill Spotlights
Data Types
What Kids Do:
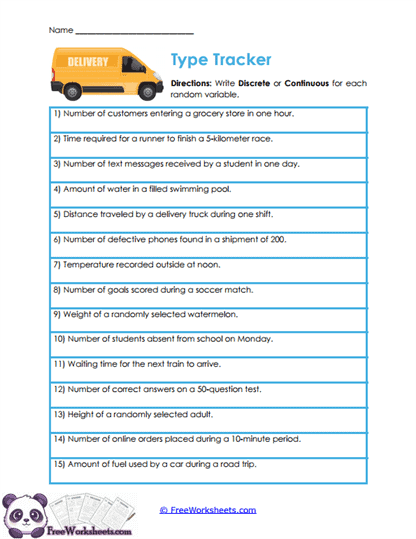
Students classify fifteen real-world random variables as discrete or continuous by deciding whether each quantity is counted or measured. The examples involve customers, race times, text messages, temperatures, sports scores, weights, distances, waiting times, orders, and other everyday quantities.
Target Skill:
This activity strengthens students’ understanding of the two major types of random variables. Students learn that discrete variables take separate countable values, while continuous variables can fall anywhere within an interval, preparing them to choose appropriate probability models later.
Distribution Audit
What Kids Do:
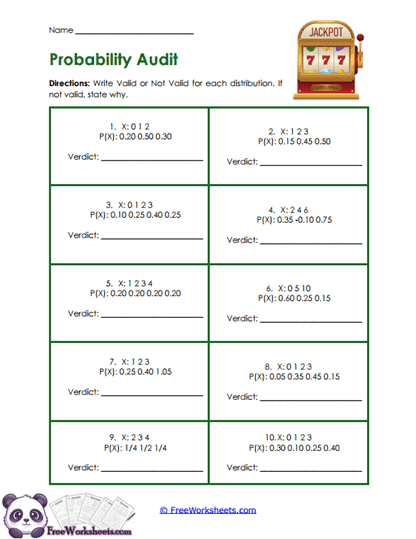
Students inspect ten proposed discrete probability tables and decide whether each one represents a valid distribution. They check every individual probability to make sure it falls between zero and one and then add all listed probabilities to verify that the total equals exactly one.
Target Skill:
Students develop a reliable validation routine for probability distributions. The worksheet reinforces the mathematical requirements of a discrete model and helps students catch invalid probabilities or incorrect totals before using a table for expected value or spread calculations.
Distribution Build
What Kids Do:
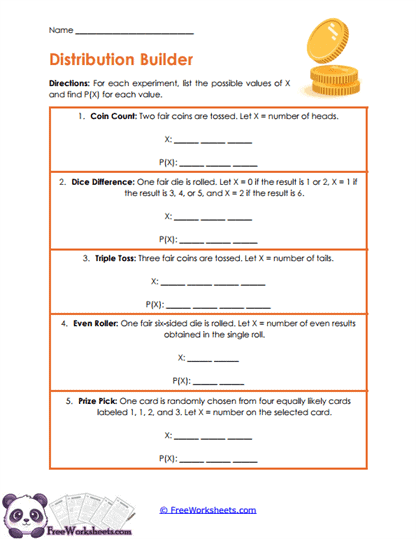
Students construct five discrete probability distributions from simple experiments involving coins, dice, and equally likely selections. They identify the possible values of the random variable, count how many basic outcomes produce each value, and assign the correct probability to every result.
Target Skill:
This worksheet develops the connection between sample spaces and complete probability distributions. Students learn that several experiment outcomes may produce the same random-variable value and that the combined probabilities across all possible values must account for the entire experiment.
Distribution Compare
What Kids Do:
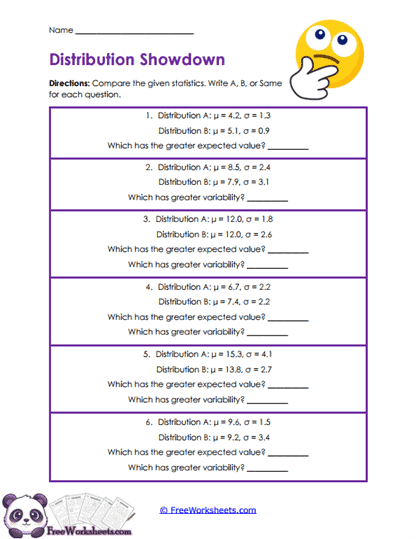
Students examine six pairs of probability distributions whose means and standard deviations are already provided. For each pair, they determine which distribution has the greater expected value and which one has greater variability, including cases where the centers are equal but the spreads differ.
Target Skill:
Students learn to compare center and spread as separate characteristics of a distribution. The activity reinforces that a larger mean does not automatically imply a larger standard deviation and that greater variability describes spread rather than whether a situation is inherently better or worse.
Distribution Spread
What Kids Do:
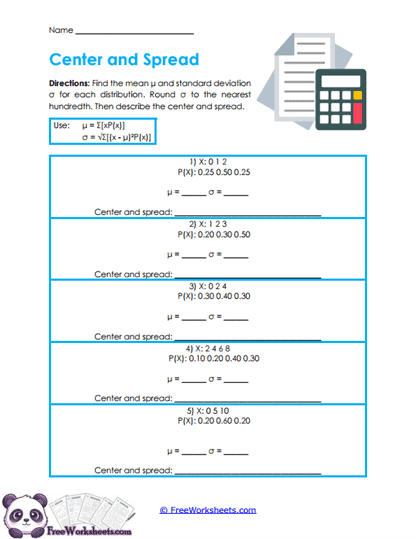
Students work with five discrete probability distributions and calculate both the mean and standard deviation. They multiply outcomes by probabilities to find the center, then use deviations from that mean to measure spread and explain what both statistics reveal about the distribution.
Target Skill:
This activity develops a complete numerical description of a discrete distribution. Students reinforce expected value, variance-related reasoning, standard deviation, and the distinction between a typical center and the amount outcomes usually vary around that center.
Expected Outcomes
What Kids Do:
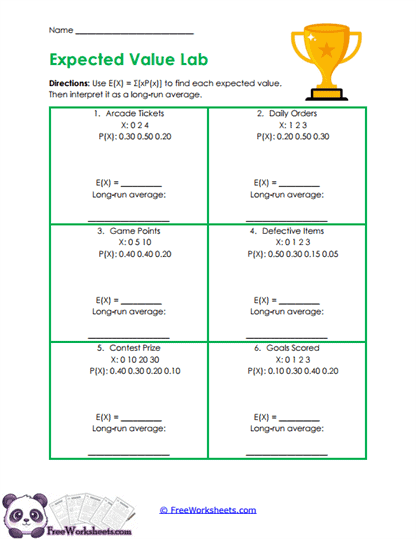
Students calculate expected values for six probability distributions involving arcade tickets, daily orders, game points, defective items, contest prizes, and goals scored. They multiply each possible outcome by its probability, add the weighted values, and interpret the result as a long-run average.
Target Skill:
Students strengthen expected-value reasoning and learn why more likely outcomes influence the average more heavily. The worksheet also reinforces that an expected value does not need to be an actual possible single-trial outcome because it summarizes behavior over many repetitions.
Game Fairness
What Kids Do:
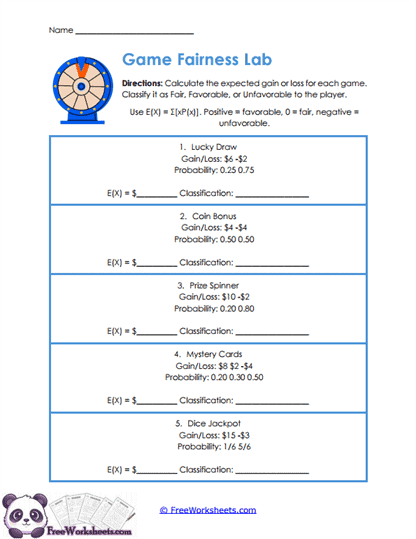
Students evaluate five games involving prizes, bonuses, spinners, cards, and dice by calculating expected gains and losses. They treat losses as negative values, weight every outcome by its probability, combine the results, and classify each game as favorable, fair, or unfavorable to the player.
Target Skill:
This activity applies expected value to decision-making and long-run financial reasoning. Students learn to consider both payoff size and probability instead of focusing only on large prizes, while reinforcing signed values and contextual interpretation of positive, zero, and negative expectations.
Histogram Match
What Kids Do:
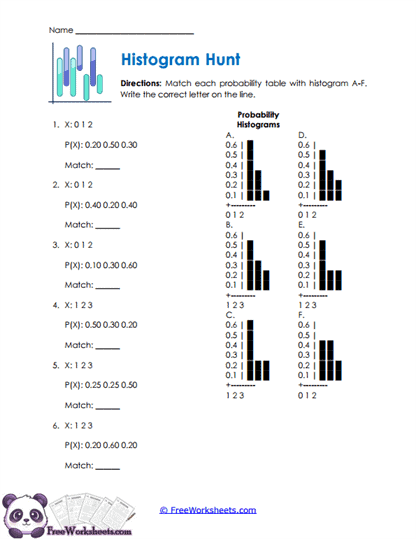
Students compare six discrete probability tables with a set of histograms and identify which graph represents each distribution. They match x-values with bar locations and probabilities with bar heights while checking overall patterns such as increasing, decreasing, or concentrated outcomes.
Target Skill:
Students develop fluency moving between numerical and graphical representations of the same distribution. The activity strengthens visual interpretation, probability-table reading, and the ability to recognize how likelihood is represented through bar height at each discrete outcome.
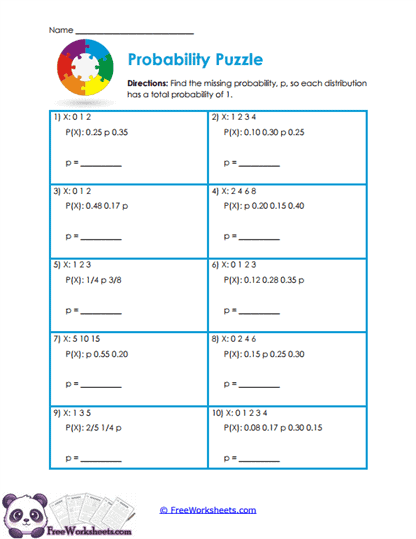
Missing Probability
What Kids Do:
Students complete ten probability tables in which one probability is represented by an unknown value. They add the probabilities already provided, subtract that total from one, and then check that the resulting missing probability falls within the valid range from zero to one.
Target Skill:
This worksheet reinforces the total-probability rule as a structural feature of a distribution. Students practice equation reasoning with decimals and fractions while learning that every listed probability contributes to one complete set of possible outcomes.
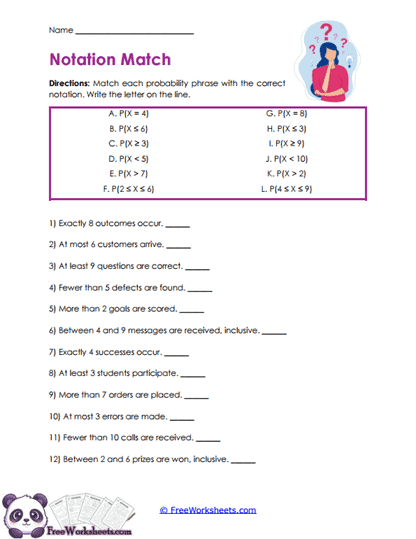
Notation Match
What Kids Do:
Students match twelve everyday probability phrases with symbolic statements involving exactly, at least, at most, fewer than, more than, and between. They pay close attention to whether each boundary value is included and recognize cases where both endpoints belong in the event.
Target Skill:
Students strengthen the language-to-symbol translation needed for probability calculations. The worksheet reinforces inclusive and exclusive inequalities so students can identify precisely which random-variable values belong in an event before adding their probabilities.
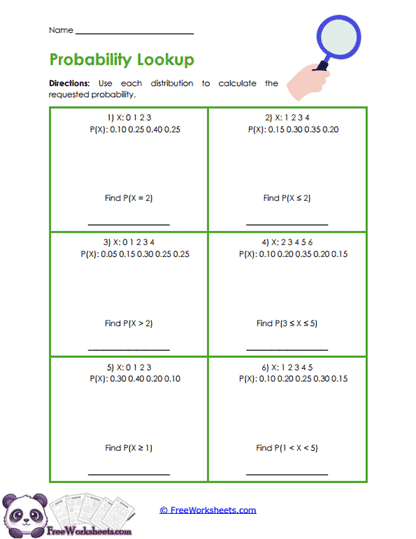
Probability Lookup
What Kids Do:
Students use six discrete probability tables to find exact and cumulative event probabilities. They identify the x-values described by phrases such as greater than, less than or equal to, or between, then add only the probabilities attached to those outcomes.
Target Skill:
This activity develops efficient reading of probability distributions as information sources. Students reinforce event notation, boundary interpretation, exact probabilities, and cumulative probability without needing to rebuild the underlying distribution from scratch.
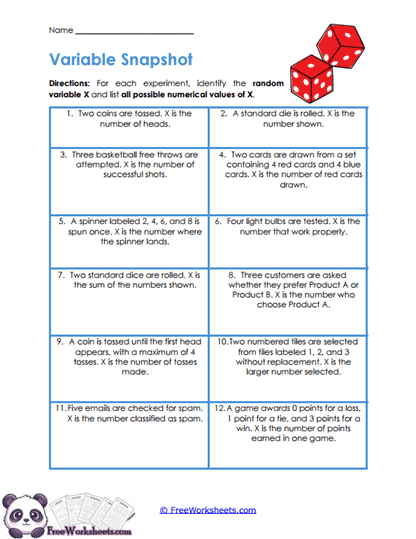
Variable Types
What Kids Do:
Students read twelve probability situations involving coins, dice, free throws, cards, light bulbs, customers, email, and games. For each situation, they define what the random variable X represents and list every numerical value that variable can possibly take.
Target Skill:
Students build the foundation for probability distributions by learning to turn experimental outcomes into numerical variables. The worksheet reinforces identifying what is actually being counted or measured, establishing possible ranges, and including values such as zero when they are realistic outcomes.