
About This Worksheet
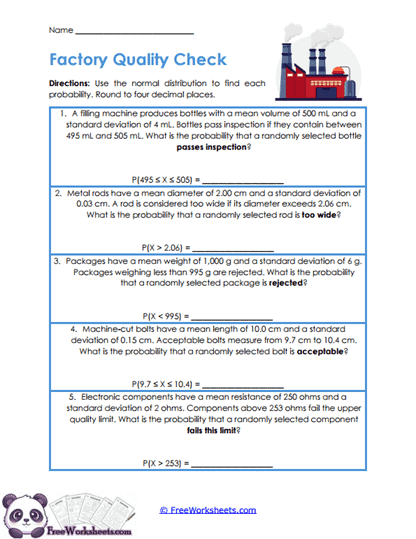
This worksheet helps twelfth-grade Pre-Calculus students apply normal-distribution probability to factory and quality-control situations. Students work through five real-world production examples involving bottle fill amounts, rod diameters, package weights, machined bolt lengths, and electronic component resistance. Each problem gives a mean, standard deviation, and an acceptable or unacceptable range.
Students use the normal distribution to determine the probability that a randomly selected item passes inspection, gets rejected, falls inside a tolerance range, or exceeds a quality limit. This gives the topic a practical connection to manufacturing and product testing.
What Students Practice
Students practice identifying whether the desired region is inside a range, below a cutoff, or above a cutoff. They then standardize the relevant value or values and calculate the matching normal probability.
The worksheet also reinforces two-sided quality limits. When an item is acceptable only if it falls between a lower and upper measurement, students must calculate the probability inside that entire interval.
Other problems use only one cutoff, such as rejecting packages below a certain weight or failing components above a maximum value. Students must read the wording carefully to determine which tail of the distribution is needed.
Why This Skill Matters
Normal distributions are widely used in manufacturing and quality control because production measurements often cluster around a target value. Probability can help estimate how many products will meet specifications and how many may need to be rejected.
This skill shows students why normal probability matters outside the classroom. A small change in a mean, standard deviation, or tolerance can affect the percentage of products that pass inspection.
Common Challenges
Students may shade or calculate the wrong region because they focus on the cutoff number but not on the wording. Encourage them to underline phrases such as passes inspection, rejected, acceptable, or fails this limit before calculating.
Another common mistake is forgetting that an acceptable range has two boundaries. Both the lower and upper values must be included when finding the probability of passing inspection.
Students may also confuse a value above the mean with a high probability. The probability depends on the whole region being measured, not simply whether the cutoff itself is large or small.
How To Use It
Teachers can use this worksheet as an applied normal-distribution lesson after students have learned z-scores and normal probabilities. It works well for independent practice, homework, small-group problem solving, or a STEM-style application activity.
Parents and homeschool teachers can ask, “What measurements pass, and what measurements fail?” Once the acceptable region is clear, students can decide whether they need the middle of the curve, the left tail, or the right tail.
Grade Alignment
This worksheet is intended for Grade 12 Pre-Calculus students studying applications of normal distributions. It reinforces probability, standardization, interpretation of intervals, and real-world modeling.
Students should already understand normal probabilities and z-scores. After this practice, they can apply normal-distribution reasoning to broader statistical, scientific, and quality-control situations.