
About This Worksheet
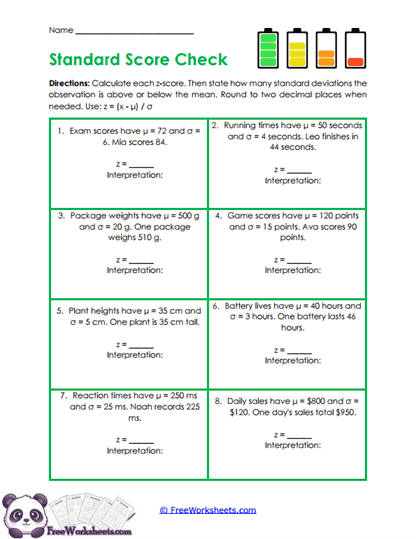
This worksheet helps twelfth-grade Pre-Calculus students practice calculating z-scores and interpreting what those scores mean in context. Students work through eight situations involving exam scores, running times, package weights, game scores, plant heights, battery life, reaction times, and daily sales.
For each problem, students compare one observed value with the mean and standard deviation of the distribution. They calculate how many standard deviations the value is above or below the mean, then explain that result in simple language.
What Students Practice
Students practice subtracting the mean from the observed value and dividing by the standard deviation. The result is a z-score, which tells how far the observation sits from the center of the distribution.
The worksheet also reinforces interpretation. A positive z-score means the value is above the mean, while a negative z-score means it is below the mean. A z-score near zero means the value is close to average.
Why This Skill Matters
Z-scores let students compare values from different normal distributions on the same scale. A score of 90 on one test may be very different from a score of 90 on another if the means and standard deviations are different.
This skill is also the bridge to finding normal probabilities. Once a value is standardized, students can use normal distribution technology to find areas and percentiles.
Common Challenges
Students may subtract in the wrong order. Remind them that the observed value comes first, then the mean is subtracted from it. Reversing that order changes the sign of the z-score.
Another common mistake is giving the z-score without explaining what it means. Encourage students to say whether the value is above or below the mean and by how many standard deviations.
How To Use It
Teachers can use this worksheet after reviewing mean and standard deviation. It works well for guided instruction, independent practice, homework, or preparation for normal probability calculations.
Parents and homeschool teachers can explain a z-score as “how many standard deviations away from average.” That plain-language meaning often makes the calculation easier to understand.
Grade Alignment
This Grade 12 Pre-Calculus worksheet supports standardization in normal distributions and prepares students for probability and percentile calculations.
Students should already understand mean and standard deviation. After this practice, they can move into shading normal curves and calculating areas under the curve.