
About This Worksheet
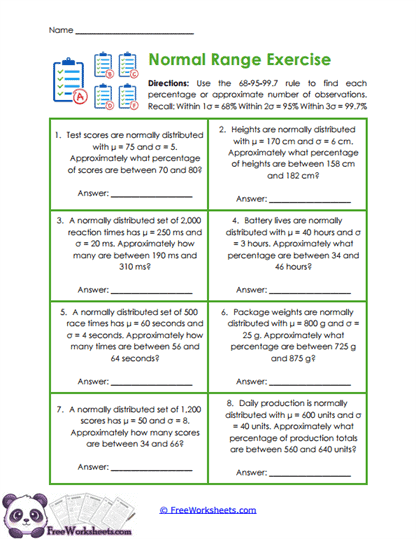
This worksheet helps twelfth-grade Pre-Calculus students practice using the 68-95-99.7 rule to estimate percentages in normal distributions. Students work through eight situations involving test scores, heights, reaction times, battery life, race times, package weights, sports scores, and production data. Each problem gives a mean and standard deviation, then asks for the approximate percent of values that fall within a certain interval.
The key idea is to compare the endpoints of the interval with the mean and decide whether they are one, two, or three standard deviations away. Once students know that distance, they can use the empirical rule to estimate the percentage.
What Students Practice
Students practice finding how far a value is from the mean in terms of standard deviations. They then connect that distance to the familiar percentages: about 68 percent within one standard deviation, about 95 percent within two, and about 99.7 percent within three.
The worksheet also reinforces the meaning of a normal distribution. Students see that values near the mean are more common, while values farther away become less common.
Why This Skill Matters
The empirical rule gives students a fast way to estimate probabilities without using more advanced technology. It helps them understand the overall shape of a normal distribution and how data spreads around the mean.
This idea is also useful later when students work with z-scores and exact normal probabilities. The 68-95-99.7 rule gives them a good sense of what answers should look like before they calculate more precisely.
Common Challenges
Students may focus only on the interval width instead of comparing each endpoint to the mean. Encourage them to ask, “How many standard deviations away is this endpoint?” on both sides.
Another common mistake is mixing up the three percentages. A helpful reminder is that the farther out the interval goes, the more of the normal curve it captures.
How To Use It
Teachers can use this worksheet as an introduction to normal distributions or as review before z-scores. It works well for guided practice, independent work, homework, or a quick concept check.
Parents and homeschool teachers can ask, “Is this interval one, two, or three standard deviations from the mean?” Once that is clear, students can match it to the correct approximate percentage.
Grade Alignment
This worksheet is designed for Grade 12 Pre-Calculus students studying normal distributions. It supports understanding of center, spread, and approximate probability in bell-shaped data.
Students should already know mean and standard deviation. After this practice, they are ready to standardize individual values with z-scores.