
About This Worksheet
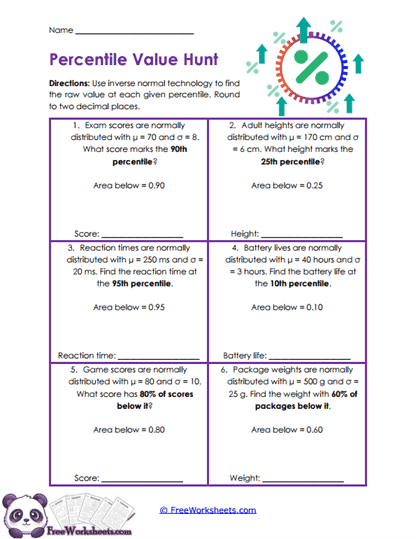
This worksheet helps twelfth-grade Pre-Calculus students practice working backward from a percentile or area to find the original value in a normal distribution. Students work through six situations involving exam scores, adult heights, reaction times, battery life, game scores, and package weights. Instead of being given a data value and asked for a probability, they are given the probability below a value and must find that value.
For example, one problem may ask for the score that has 90 percent of scores below it. Another may ask for the height at the 25th percentile. Students use inverse normal technology to find the matching standard score and then convert that result back into the original units.
What Students Practice
Students practice interpreting percentiles as areas to the left under a normal curve. They identify the given area, use inverse normal technology, and then connect the result back to the original distribution.
The worksheet also reinforces units and context. The final answer may be a test score, height, reaction time, battery life, game score, or package weight. Students must make sure the result is reported in the correct unit, not just as a calculator value.
Why This Skill Matters
Percentiles are used constantly in real-world data. Test scores, growth measurements, performance statistics, and quality measurements are often described in terms of what percent of values fall below a certain point.
This skill also deepens students’ understanding of the normal curve. Earlier problems move from a value to an area. These problems reverse that process and move from an area back to a value. Being able to work in both directions gives students a more complete understanding of normal distributions.
Common Challenges
Students may confuse a percentile with the percent above a value. Remind them that the percentile usually refers to the percentage of values below that point. A 90th-percentile score has about 90 percent of scores below it.
Another common mistake is stopping with the standard score. The question asks for the original score, height, time, or measurement, so students must convert back to the real units of the problem.
Students may also enter the percentage incorrectly into technology. For example, 90 percent should be entered as a decimal area of 0.90.
How To Use It
Teachers can use this worksheet after students are comfortable finding normal probabilities from raw values. It works well for guided inverse-normal practice, independent work, homework, or review.
Parents and homeschool teachers can explain the process as “start with the percent, find where that point sits on the bell curve, then turn it back into the real measurement.” This keeps the purpose of each step clear.
Grade Alignment
This Grade 12 Pre-Calculus worksheet supports inverse normal reasoning and percentile interpretation within normal distributions. It reinforces the connection between standardized values, cumulative area, and original data.
Students should already understand z-scores and normal probabilities. After this practice, they are ready for applied quality-control problems involving acceptable ranges and cutoff values.