
Graphing Linear Equations Worksheets
9th grade math graphing linear equations worksheets help students connect equations, ordered pairs, slope, intercepts, tables, and coordinate-plane graphs. Free, ready-to-print worksheets in PDF format are designed for immediate classroom use, guided practice, homework, intervention, or homeschool lessons. Students strengthen slope interpretation, coordinate graphing, and linear-function reasoning while developing skills that support 9th grade curriculum expectations.
About This Collection of Worksheets
Graphing linear equations helps 9th grade students understand how algebraic rules create visible patterns on the coordinate plane. Students learn how ordered pairs satisfy equations, how slope controls the direction and steepness of a line, and how the y-intercept identifies an important starting point. They also explore x-intercepts, horizontal and vertical lines, fractional slopes, negative slopes, and other features that help them move confidently between equations and graphs.
This collection includes several ways to practice linear graphing rather than relying on one repeated method. Students check whether points lie on lines, generate tables of values, identify slope and y-intercept, graph from slope-intercept form, work with negative and fractional slopes, find intercepts, classify horizontal and vertical lines, match graph descriptions with equations, repair graphing mistakes, complete partially drawn lines, and apply linear equations to changing game scores. These activities help students connect symbolic, numerical, verbal, and visual representations of the same linear relationship.
Teachers can use these worksheets throughout a 9th grade linear-functions unit for modeling, guided practice, independent work, homework, intervention, math centers, review, or formative assessment. Parents, tutors, and homeschool educators can also use individual pages to focus on a specific graphing skill before combining multiple ideas. The range of activities gives students repeated practice recognizing what slope and intercepts mean while building the accuracy needed to graph linear equations independently.

Paul’s Teacher Tip
Before students graph an equation, have them identify what information the form of the equation gives them and choose the simplest graphing method from there. For equations in y = mx + b form, teach the routine find b, plot b, use m, while standard-form equations may be easier to graph using x- and y-intercepts. When slope is negative or fractional, have students rewrite it explicitly as a fraction and describe the rise and run aloud before plotting another point. If a graph does not look right, ask students to substitute one plotted point back into the original equation as a quick accuracy check. For stronger understanding, have students explain how changing only the slope or only the y-intercept would affect the graph.
Worksheet Collection Skill Spotlights
Axis Lines
What Kids Do:
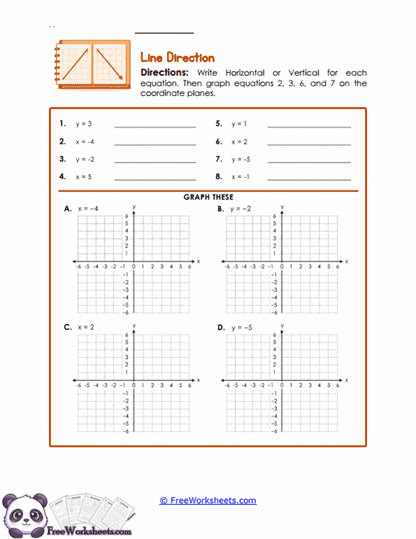
Students classify equations such as y = 3 and x = -4 as horizontal or vertical and then graph selected examples on coordinate planes. They focus on which coordinate remains fixed, plot several points that satisfy the equation, and draw the line without relying on ordinary slope-intercept procedures.
Target Skill:
Students strengthen their understanding of special linear equations by connecting y = constant with horizontal lines and x = constant with vertical lines. The activity also reinforces zero slope, undefined slope, fixed coordinates, and 9th grade coordinate-plane reasoning.
Falling Lines
What Kids Do:
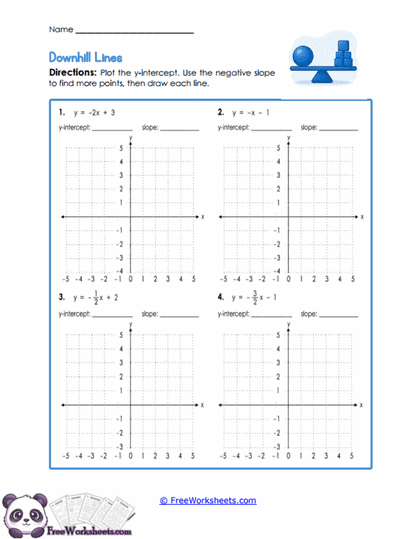
Students graph linear equations with negative slopes by first plotting the y-intercept and then using downward or leftward rise-over-run movement to generate additional points. They work with whole-number and fractional negative slopes and check that each completed line falls from left to right.
Target Skill:
This activity develops accurate graphing of decreasing linear relationships. Students connect negative slope with visual direction, distinguish negative movement from positive slope, and strengthen 9th grade understanding of how algebraic signs affect the behavior of a linear function.
Fraction Rise
What Kids Do:
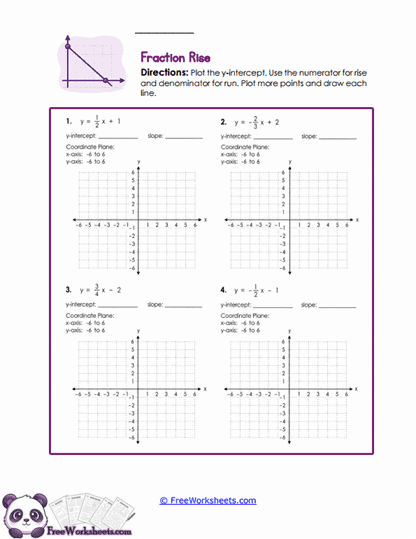
Students graph equations with fractional slopes by identifying the y-intercept, plotting the starting point, and using the numerator as the vertical change and denominator as the horizontal change. They repeat the movement to create several points for both positive and negative fractional slopes.
Target Skill:
Students deepen their understanding of slope as a ratio of vertical change to horizontal change. The worksheet reinforces rational-number slope, rise over run, graph direction, and the 9th grade connection between fractional rates of change and the steepness of linear graphs.
Graph Pairing
What Kids Do:
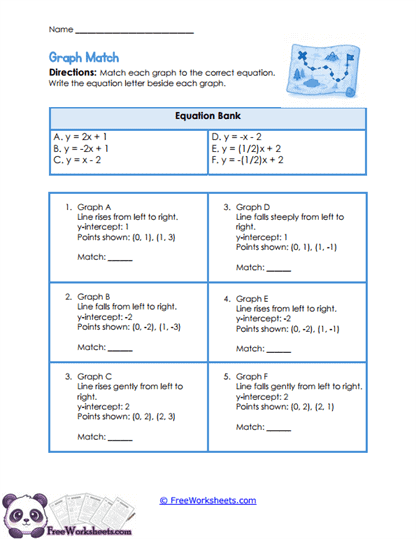
Students read descriptions of linear graphs that include direction, y-intercept, steepness, and sample coordinate points. They compare those clues with equations from an answer bank and choose the equation whose slope and intercept match every feature described.
Target Skill:
The activity strengthens students’ ability to connect verbal, graphical, numerical, and algebraic representations of linear functions. Students analyze slope sign, slope size, intercepts, and points together instead of matching equations based on only one feature.
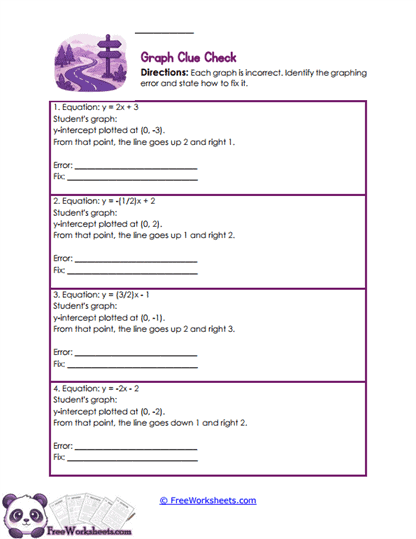
Graph Repair
What Kids Do:
Students analyze descriptions of incorrectly graphed linear equations and identify exactly what went wrong. They check whether the y-intercept was plotted correctly, whether rise over run matches the slope, and whether the sign of the slope produces the proper line direction before explaining how to fix the graph.
Target Skill:
Error analysis strengthens conceptual understanding of slope-intercept form and helps students diagnose their own graphing mistakes. Students practice separating the roles of m and b, interpreting slope movement accurately, and explaining graph corrections using clear 9th grade mathematical reasoning.
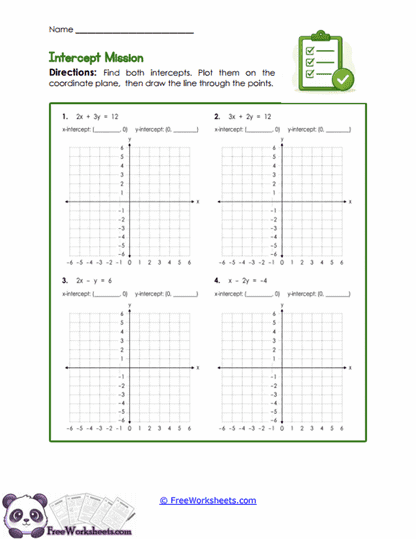
Intercept Hunt
What Kids Do:
Students graph linear equations by finding both intercepts instead of rewriting every equation in slope-intercept form. They set y equal to zero to find the x-intercept, set x equal to zero to find the y-intercept, plot the two resulting points, and draw the line through them.
Target Skill:
Students learn an efficient alternative for graphing equations written in standard form. The activity reinforces substitution, equation solving, ordered pairs, axis locations, and the meanings of x- and y-intercepts while building strategic flexibility with 9th grade linear equations.
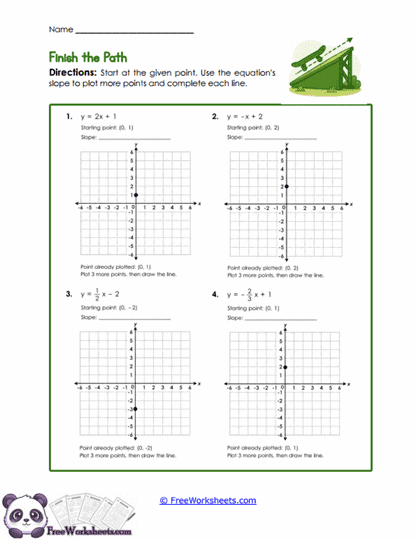
Line Finish
What Kids Do:
Students begin with a point that is already plotted for each linear equation and use the equation’s slope to generate three additional points. They repeat the same rise-over-run movement from one point to the next and then connect the points to complete the straight line.
Target Skill:
This worksheet reinforces the idea that a linear function has a constant rate of change across its entire graph. Students practice interpreting slope as repeated coordinate movement and using that consistency to extend lines accurately from a known starting point.
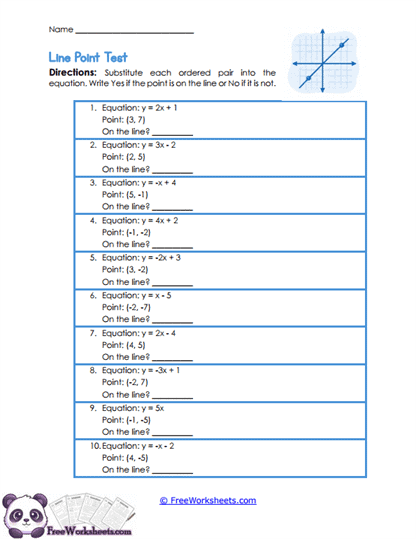
Point Check
What Kids Do:
Students receive ten linear equations paired with proposed ordered points and substitute each x- and y-value into the equation. They calculate carefully, compare both sides, and decide whether the resulting statement is true, showing whether each point actually lies on the corresponding line.
Target Skill:
Students strengthen the foundational idea that the graph of an equation consists of all ordered pairs that satisfy it. The activity builds substitution accuracy, coordinate understanding, integer operations, and a reliable method for checking whether plotted points belong to 9th grade linear graphs.
Score Graphs
What Kids Do:
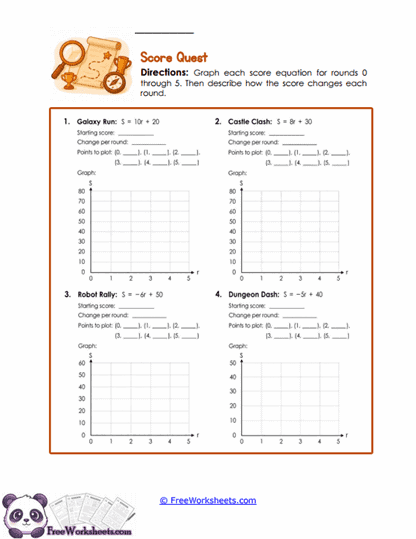
Students analyze game-score equations that include a starting score and a constant change per round. They identify both values, calculate scores for several rounds, organize the results as ordered pairs, plot those points, and draw the linear pattern that represents the changing score.
Target Skill:
Students connect slope and intercept with real-world meaning by interpreting the coefficient as the score change per round and the constant as the starting value. The activity strengthens 9th grade linear modeling, table construction, graphing, and contextual function interpretation.
Slope Parts
What Kids Do:
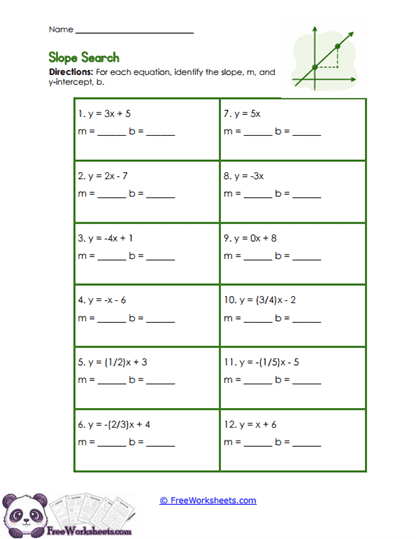
Students inspect twelve equations written in slope-intercept form and identify m as the slope and b as the y-intercept. They work with positive, negative, fractional, zero, and implied slopes, including equations where the intercept or coefficient is not written explicitly.
Target Skill:
This activity builds quick recognition of the two key parameters used to graph linear equations from y = mx + b. Students distinguish coefficients from constants, interpret hidden values such as m = 1, and prepare to use slope and intercept efficiently when graphing.
Slope Steps
What Kids Do:
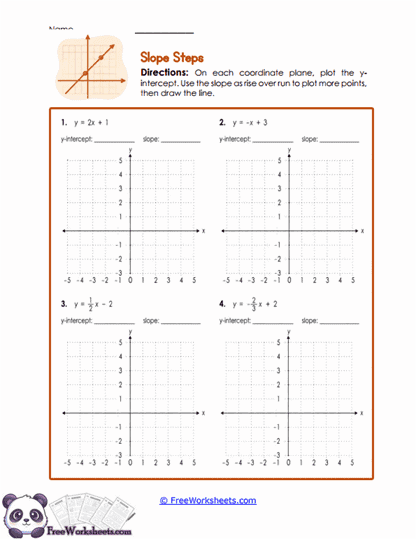
Students graph linear equations by identifying the y-intercept, plotting that point first, and then using slope as rise over run to create additional coordinates. They repeat the movement accurately for positive, negative, and fractional slopes before drawing each completed line.
Target Skill:
Students develop a dependable procedure for translating slope-intercept form directly into a graph. The worksheet reinforces the roles of m and b, coordinate movement, line direction, and 9th grade understanding of how equation parameters control a linear graph.
Value Tables
What Kids Do:
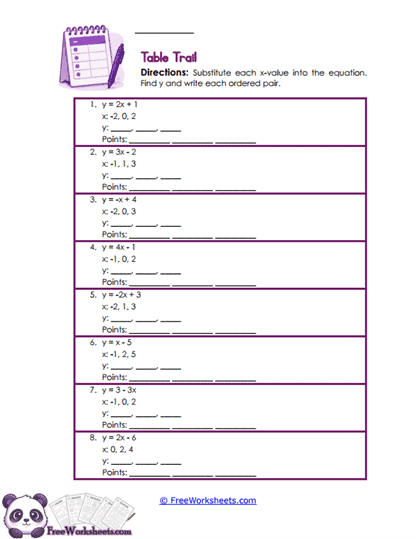
Students substitute several given x-values into each of eight linear equations, calculate the corresponding y-values, and record the results as ordered pairs. They use positive and negative inputs and organize the values so the completed points can later be plotted on a coordinate plane.
Target Skill:
Students strengthen the connection among equations, input-output values, tables, and coordinate graphs. The activity reinforces substitution, integer arithmetic, ordered-pair notation, and the 9th grade concept that a linear equation generates many points that all belong to the same line.