
About This Worksheet
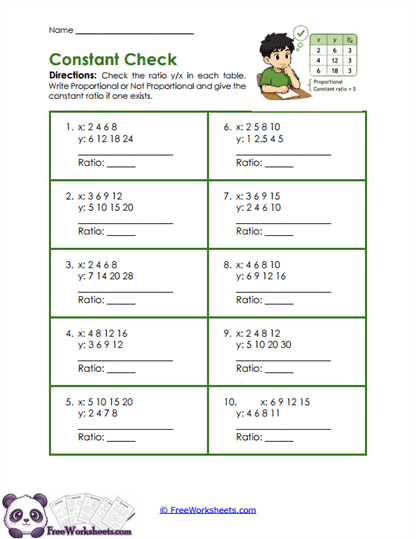
This worksheet helps eighth-grade students decide whether x-and-y tables show proportional relationships and, when they do, identify the constant ratio. Students examine ten tables and compare the y-values with the corresponding x-values. If the same value of y/x appears throughout the table, the relationship is proportional. If the ratio changes, students label the table as not proportional.
For example, if x-values 2, 4, 6, and 8 match y-values 6, 12, 18, and 24, then y/x is always 3. That means the table is proportional and the constant ratio is 3. Other tables are designed so the ratio changes, requiring students to look beyond a simple visual pattern.
What Students Practice
Students practice dividing corresponding y-values by x-values to test whether a constant of proportionality exists. They compare several pairs in each table rather than relying on just one. This helps them understand that a proportional relationship must stay consistent across all the data.
The worksheet also builds a bridge between ratios and functions. Students begin to see that proportional tables follow a rule of the form y = kx. The constant ratio they identify is the same k that appears in the equation.
Why This Skill Matters
Recognizing proportional relationships from tables is important because tables are one of the main ways relationships are represented in middle-school math. Students need to know whether the rate stays constant before they can call a relationship proportional. This understanding becomes especially useful when comparing tables, graphs, and equations.
The constant of proportionality also connects directly to slope. In a proportional linear relationship, the constant rate is the slope of the graph. This worksheet therefore helps prepare students for Grade 8 work with linear equations and functions.
Common Challenges
Students may compare how much the x-values and y-values increase rather than checking the ratio between them. A table can have regular increases without being proportional. Encourage students to calculate y ÷ x for several columns.
Another common mistake is checking only the first pair and assuming the rest follow the same rule. Remind students that the ratio must stay constant throughout the whole table. One mismatched pair means the relationship is not proportional.
How To Use It
Teachers can use this worksheet after introducing the constant of proportionality and proportional tables. It works well for guided practice, independent classwork, homework, or review before graphing proportional relationships. Completing one proportional and one nonproportional example together can help students see what to look for.
Parents and homeschool teachers can ask, “What do we get when we divide y by x?” Have the student repeat that check for several columns. If the answer stays the same every time, the table is proportional.
Grade Alignment
This worksheet supports Grade 8 math by reinforcing the proportional reasoning students need for linear relationships. It builds directly on CCSS 7.RP.A.2, especially identifying constants of proportionality in tables, and supports CCSS 8.EE.B.5, where students connect unit rate with slope in proportional relationships. The activity helps students move naturally from ratios into linear functions.
Students should already understand division, ratios, and basic tables. After completing this worksheet, they are ready to write proportional equations, graph proportional relationships, and connect the constant of proportionality to slope.