
About This Worksheet
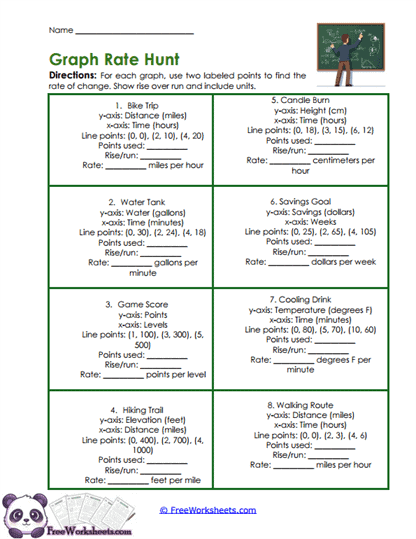
This worksheet helps Grade 8 students find rate of change from points on a graph or line. Eight different real-world situations are provided, including a bike trip, water tank, game score, hiking trail, candle burn, savings goal, cooling drink, and walking route. Instead of drawing each graph from scratch, students are given several points from the line and use two of those points to calculate the rate.
Students find the rise and run between the chosen points and then divide the change in y by the change in x. For example, if distance rises from 10 miles to 20 miles while time increases from 1 hour to 2 hours, the rise is 10 and the run is 1, giving a rate of 10 miles per hour. The worksheet then asks students to write the answer with the correct real-world units.
What Students Practice
Students practice selecting two points, finding the vertical change, finding the horizontal change, and using those values to calculate slope. The worksheet repeatedly connects rise over run with the more formal idea of change in y over change in x. This helps students understand that the two phrases describe the same calculation.
Students also work with many different units, such as miles per hour, gallons per minute, points per level, feet per mile, centimeters per hour, dollars per week, degrees per minute, and miles per hour. That variety is important because it reminds students that a rate is not complete until its units are understood. The numbers tell how much something changes, while the units tell what that change means.
Why This Skill Matters
Finding slope from two points is one of the most important skills students develop when learning about linear relationships. It allows them to describe how steeply a line rises or falls and connect that visual change to a meaningful rate. Students will use the same process when working with coordinate graphs, tables, equations, and linear models.
The real-world settings on this worksheet make the idea more concrete. A slope is no longer just a fraction such as 10/2; it can mean 5 gallons per minute or 5 dollars per week. Making that connection helps students understand why slope is useful instead of seeing it as one more formula to memorize.
Common Challenges
Students sometimes reverse the rise and run and divide change in x by change in y. Remind them that the usual order is change in y over change in x. Writing the y-change on top and the x-change underneath before dividing can prevent many mistakes.
Another problem happens when students use points in different orders. Either order works, but the order must stay the same for both coordinates. If a student calculates the y-change from the second point to the first point, the x-change must be calculated in that same direction. Encourage students to label the two points clearly before subtracting.
How To Use It
Teachers can use this worksheet during a lesson on slope, immediately after modeling how to calculate rise over run from two points. The first problem can be completed together, with students identifying the two points, the rise, the run, the numerical rate, and the correct unit. The remaining problems then provide strong independent practice with the same process in several different settings.
Parents and homeschool teachers can keep the explanation simple by asking students to compare two points one step at a time. First ask how much the y-value changed, then how much the x-value changed, and finally have the student divide those changes. Once the calculation is finished, ask what the answer means in the story so the student practices both finding and interpreting the rate.
Grade Alignment
This worksheet is written for Grade 8 math and supports students as they connect slope with rate of change. It aligns closely with CCSS 8.EE.B.5, which focuses on interpreting the unit rate of a proportional relationship as the slope of its graph. It also supports CCSS 8.F.B.4 by asking students to work with rates of change in realistic linear situations.
Students should already know how to read ordered pairs and subtract positive and negative numbers. After this practice, they are ready to compare slopes across graphs, tables, and equations and to use slope as part of the equation y = mx + b.