
About This Worksheet
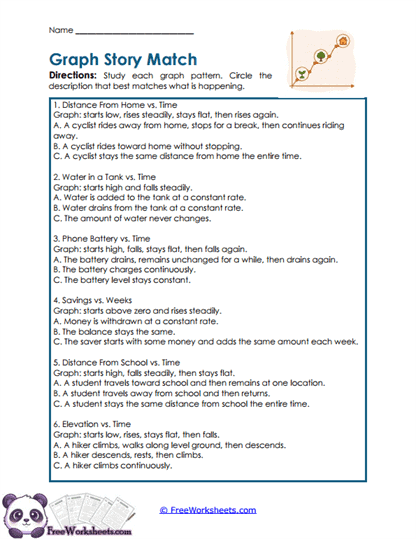
This Grade 8 worksheet helps students interpret graph shapes by matching them with the real-world stories they represent. Students read graph descriptions involving distance, water level, battery charge, savings, location, and elevation, then choose the situation that best matches the pattern. The activity asks students to think about whether a graph rises, falls, stays flat, changes direction, or combines several of these behaviors. This helps students connect visual function behavior with meaningful events in a story.
Curriculum and Grade Alignment
This worksheet supports CCSS.MATH.CONTENT.8.F.B.5, which asks students to describe qualitatively the functional relationship between two quantities by analyzing a graph. Students interpret increasing, decreasing, and constant intervals and connect those visual changes to real-world contexts. The activity strengthens conceptual understanding of function behavior without requiring formal slope calculations.
Student Tasks
Students analyze six graph descriptions and compare each one with three possible real-world interpretations. They decide which story matches the sequence of changes shown by the graph, such as rising steadily, remaining constant for a time, falling, or changing direction. Students work with contexts involving travel, water levels, battery life, savings, distance from school, and elevation. They must focus on how the quantity changes over time rather than only on whether the graph ends high or low.
Common Challenges and Misconceptions
Students may focus only on the overall direction of the graph and ignore flat sections or changes in direction. Others may confuse a flat segment with zero value instead of understanding that the quantity is staying constant. Students may also mix up what it means for distance from a location to rise or fall. Encourage them to describe the graph one section at a time before choosing the matching story.
Implementation Guidance
Model one problem by reading the graph behavior in sequence: “rises, stays flat, then rises again.” Then compare that sequence with each story choice. Encourage students to use words such as increasing, decreasing, constant, and turning point when explaining their reasoning. This worksheet works especially well for partner discussion because students can justify why one story fits better than the others. It can also serve as review before students sketch graphs from verbal descriptions.
Details and Features
The worksheet includes six real-world graph-matching situations, each with one graph pattern description and three possible interpretations. Contexts include distance, water, battery life, savings, school travel, and hiking elevation. The multiple-choice format provides structured practice with qualitative graph analysis while still requiring close reading and reasoning.