
About This Worksheet
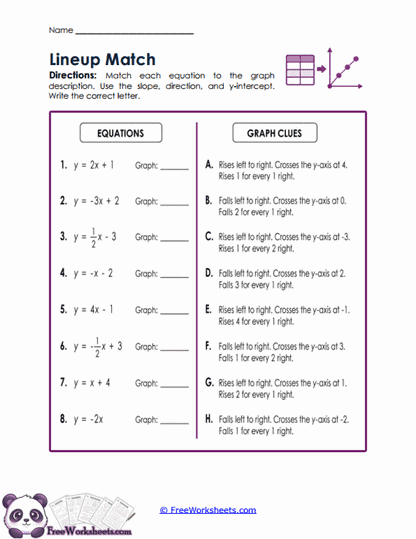
This worksheet helps eighth-grade students connect linear equations with verbal descriptions of their graphs. Each equation must be matched with a graph clue that describes whether the line rises or falls, where it crosses the y-axis, and how quickly it changes. Students use both slope and y-intercept to make the match. This gives them practice reading an equation and mentally picturing the graph without actually drawing it. It is a strong activity for helping students understand how y = mx + b controls the shape and position of a line.
What Students Practice
Students identify the sign and size of the slope to determine whether a line rises or falls and how steeply it changes. They also use the y-intercept to decide where the line crosses the vertical axis. The clues include statements such as rising one unit for every unit to the right or falling several units for a horizontal move. Students compare both pieces of information before choosing the correct match. This combines equation reading, slope interpretation, y-intercept identification, and graph reasoning in one exercise.
Why This Matters
Students who understand slope and y-intercept should be able to imagine what a line looks like from the equation alone. This skill makes graphing faster and also helps them detect mistakes before they ever plot a point. It becomes especially useful when comparing multiple linear equations or solving systems. Understanding the meaning of rise, fall, and intercept also prepares students for more advanced function analysis. This worksheet strengthens that mental connection between symbolic and graphical forms.
Teaching Tips
Have students underline the slope and circle the y-intercept in each equation before reading the graph clues. First decide whether the line rises, falls, or stays flat, then match the starting point on the y-axis. If two clues still seem possible, compare the steepness using the slope value. For fractional slopes, remind students to read the fraction as rise over run. This step-by-step approach makes the matching much more manageable.
Curriculum Standards
This worksheet supports CCSS.MATH.CONTENT.8.EE.B.6 by reinforcing slope as a rate of change and connecting slope with linear graphs. It also supports CCSS.MATH.CONTENT.8.F.B.4 because students interpret both rate of change and initial value from equations. The multiple-representation work strengthens students’ ability to move between symbolic and graphical descriptions. It is well suited for independent practice, homework, intervention, or review before graphing equations directly.