
About This Worksheet
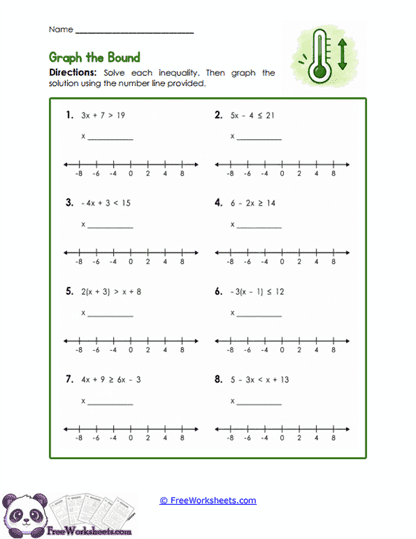
This worksheet helps ninth-grade students solve multi-step linear inequalities and then graph the solution on a number line. Students work through eight problems that include distribution, combining like terms, and variables on both sides. After solving for x, they show the answer visually with the correct endpoint and shading direction. This gives students practice connecting symbolic inequality solutions with a graph.
For example, if a problem simplifies to x > 4, students place an open circle at 4 and shade to the right. If the answer is x ≤ -2, they use a closed circle at -2 and shade to the left. These graphs help students see that an inequality represents many possible values, not just one answer.
What Students Practice
Students practice solving multi-step inequalities and translating the final result to a number line. They must decide whether the endpoint is included and whether the solution extends toward greater or lesser values. This reinforces both algebra and graphing skills.
The worksheet also includes negative coefficients, so students may need to reverse the inequality symbol during the solving process. That means they must get both the algebra and the graph direction correct. Repeated practice helps connect those two steps more clearly.
Why This Skill Matters
Graphing an inequality makes the solution set easier to understand. Students can immediately see whether the answer includes values greater than or less than a boundary and whether the boundary itself is included. This visual representation is an important part of Algebra 1.
The skill also prepares students for compound inequalities and systems of inequalities. Once students can graph one inequality correctly, they are better prepared to combine and compare multiple solution regions. Strong number-line skills make those later topics easier.
Common Challenges
Students may solve the inequality correctly but shade in the wrong direction. Encourage them to read the final answer aloud before graphing. “x is greater than 4” should point toward larger numbers, while “x is less than 4” should point toward smaller numbers.
Another common mistake is choosing the wrong endpoint style. Strict inequalities use open circles, while ≤ and ≥ use closed circles. Have students check the symbol one final time before drawing the graph.
How To Use It
Teachers can use this worksheet after students are comfortable solving multi-step inequalities symbolically. It works well for independent practice, homework, guided review, or a graphing station. Modeling one positive and one negative boundary example can help students connect the algebra to the graph.
Parents and homeschool teachers can ask, “Is the boundary included?” and then, “Are the answers bigger or smaller than that number?” Those two questions usually make the graphing step much easier.
Grade Alignment
This worksheet is designed for Grade 9 Algebra 1 and supports CCSS HSA-REI.B.3, which includes solving linear inequalities in one variable. It also reinforces representing solution sets visually on a number line. The mixed multi-step format helps students combine algebraic and graphical reasoning.
Students should already know how to solve linear inequalities and use open and closed endpoints. After this practice, they can move into graphing compound inequalities and more complex solution sets.