
About This Worksheet
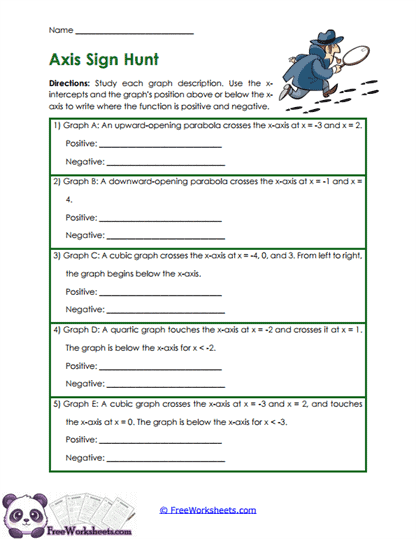
This worksheet helps twelfth-grade Pre-Calculus students practice using graph descriptions and x-intercepts to decide where a function is positive or negative. Students work through five polynomial graph situations, including parabolas, cubics, and a quartic. For each one, they are told where the graph crosses or touches the x-axis and whether parts of the graph lie above or below it.
The goal is to turn that graph information into intervals. When the graph is above the x-axis, the function is positive. When the graph is below the x-axis, the function is negative. Students use the intercepts as the places where the sign may change.
What Students Practice
Students practice reading x-intercepts as important dividing points on the number line. They then determine what happens between and beyond those points based on the graph description.
The worksheet also helps students understand the difference between a graph that crosses the x-axis and one that simply touches it. When the graph crosses, the sign usually changes. When it touches and turns around, the sign can stay the same.
Students write the positive and negative regions using interval notation, which ties graph behavior directly to algebraic solutions.
Why This Skill Matters
Nonlinear inequalities can often be solved by understanding where a graph sits compared with the x-axis. If students can read that behavior, they do not always need to test many values algebraically.
This skill also builds a stronger connection between equations and graphs. Zeros are not just answers to equations-they are the places where the function reaches the x-axis and may change sign.
Common Challenges
Students may think every x-intercept causes the sign to change. Remind them that a graph can touch the x-axis and turn back without crossing it. In that case, the sign stays the same on both sides.
Another common mistake is reversing positive and negative regions. A simple reminder is that above the x-axis means positive and below the x-axis means negative.
Students may also accidentally include an intercept in a positive or negative interval. At an x-intercept, the function equals zero, so it is neither positive nor negative.
How To Use It
Teachers can use this worksheet after students understand critical values and sign charts. It works well for guided graph discussion, independent practice, homework, or review before solving inequalities from graphs.
Parents and homeschool teachers can ask, “Is the graph above or below the x-axis in this section?” Once that is clear, students can label the interval as positive or negative.
Grade Alignment
This worksheet is designed for Grade 12 Pre-Calculus students studying polynomial graphs and nonlinear inequalities. It reinforces the relationship between x-intercepts, graph position, and function sign.
Students should already understand interval notation and basic polynomial graph behavior. After this practice, they can focus more closely on deciding whether individual boundary values belong in a solution.