
About This Worksheet
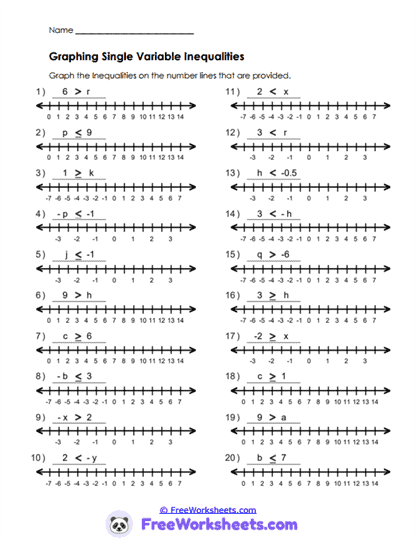
Linear inequalities can be shown visually on a number line using open and closed circles with shaded directions. This worksheet helps students graph single-variable inequalities on number lines and connect inequality symbols to visual representations. Students learn that an open circle means the endpoint is not included, while a closed circle means it is included. For example, x>4x > 4x>4 is graphed with an open circle at 4 and shading to the right. The activity helps students strengthen their understanding of inequality solutions and graph interpretation.
Curriculum and Grade Alignment
This worksheet supports Algebra 2 standards involving graphing and interpreting linear inequalities. The main learning goal is to represent inequality solutions correctly on a number line. Students should already understand inequality symbols before beginning. The next learning step is solving and graphing multi-step inequalities. This aligns with HSA-REI.B.3 because students solve and graph inequalities in one variable.
Student Tasks
On this worksheet, students will graph inequalities using number lines and determine the correct direction for shading. They will identify whether each graph should use an open or closed circle based on the symbol. Students also connect inequality notation to visual solution sets. Several problems ask learners to compare how different inequality symbols affect the graph.
Common Challenges and Misconceptions
Some students may confuse open circles with closed circles while graphing. Others may shade the wrong direction because they misunderstand the meaning of the inequality symbol. A common mistake is treating > and ≥ the same way on the graph. Teachers can help by encouraging students to read the inequality aloud before graphing.
Implementation Guidance
This worksheet works well during early lessons on graphing inequalities or as review before solving more complex inequality problems. Teachers can model one example with an open circle and one with a closed circle before assigning independent work. Parents helping at home can ask students why a graph uses an open or closed circle. Those explanations often help students remember the difference more confidently.
Details and Features
The worksheet includes multiple number-line graphing problems with a variety of inequality symbols. Students practice graphing solutions visually and interpreting inequality notation. The printable layout provides clear number lines and organized spaces for graphing work. The repeated practice helps students build fluency with visual inequality representations.