
About This Worksheet
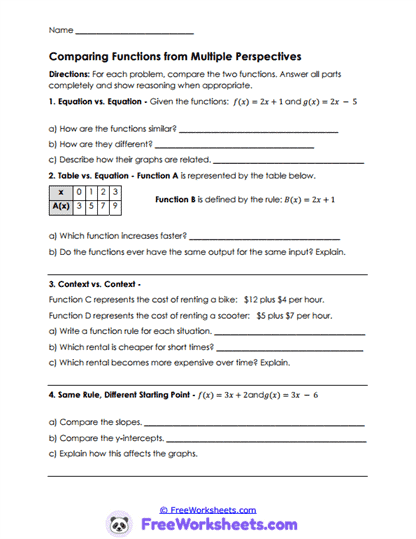
Functions can be compared using equations, tables, graphs, and real-world situations. This worksheet helps students study how different functions behave and how they can represent similar or different relationships. Students compare rates of change, starting values, and patterns between functions shown in multiple forms. For example, two linear equations may have the same slope but different y-intercepts. The activity helps students build stronger understanding of how functions can be analyzed from different perspectives.
Curriculum and Grade Alignment
This worksheet supports Algebra 2 standards involving interpreting and comparing functions represented in different ways. The main learning goal is to compare functions using equations, tables, and contextual descriptions. Students should already understand linear functions and basic graph interpretation before beginning. The next learning step is analyzing more complex function families and transformations. This aligns with HSF-IF.C.9 because students compare properties of functions represented algebraically, numerically, and verbally.
Student Tasks
On this worksheet, students will compare functions represented by equations, tables, and real-world scenarios. They will identify similarities and differences such as slopes, starting values, and rates of increase. Students also explain how graphs and tables connect to the equations being studied. Several problems ask learners to describe which function changes faster and justify their reasoning.
Common Challenges and Misconceptions
Some students may confuse slope with the y-intercept when comparing equations. Others may focus only on one representation instead of comparing all the information provided. A common mistake is assuming two functions are identical because they both increase. Teachers can help by encouraging students to compare both the rate of change and the starting point carefully.
Implementation Guidance
This worksheet works well during lessons on comparing linear functions and interpreting multiple representations. Teachers can model one comparison problem using a table and equation before assigning independent work. Parents helping at home can ask students to explain how they know which function increases faster. Those conversations often help students organize their reasoning more clearly.
Details and Features
The worksheet includes equations, tables, and real-world contexts involving function comparisons. Students practice analyzing rates of change, y-intercepts, and relationships between representations. The printable layout provides organized answer spaces for written explanations and calculations. The comparison structure helps students deepen their understanding of function behavior.