
About This Worksheet
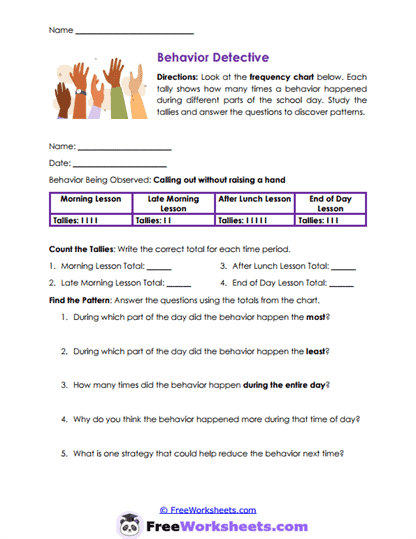
This worksheet is a behavior-frequency analysis activity that helps students study when a behavior happens most and least during the school day. It is a good fit for students in grades 3 through 6 who can count tally marks and compare totals. Children examine calling out without raising a hand across four lesson periods and then answer questions about the pattern. For example, “Calling out was worse later” becomes “The behavior happened most after lunch and least at the end of the day.”
Curriculum and Grade Alignment
The main goal is to help students move from simply counting behavior to thinking about when and why it happens. Students should already know how tally marks work and how to calculate a total. The next skill is using the pattern to choose a support or strategy for the most difficult time of day. This worksheet supports CASEL self-awareness and responsible decision-making because students use evidence to understand behavior and plan a better response.
Student Tasks
On this worksheet, students will count tally marks for four different lesson periods. They write a total for the morning lesson, late morning lesson, after-lunch lesson, and end-of-day lesson. Students identify when the behavior happened most and least and calculate the full-day total. They also suggest why the behavior may have increased during one period and choose a strategy that could reduce it next time.
Common Challenges and Misconceptions
Some students may miscount groups of tally marks or forget to combine all four periods for the daily total. Others may assume the time with the highest number automatically proves the cause of the behavior. Children can also suggest a reason without using any evidence from the chart. Teachers can help by separating what the data clearly shows from what students are only guessing about the cause.
Implementation Guidance
Teachers can use this worksheet during behavior-data lessons, math practice, counseling groups, or individual progress reviews. It provides a simple way to teach that behavior patterns often change across different times of day. Parents and homeschool educators can create similar tally charts for home routines, homework, or family activities. Adults should help students choose one realistic strategy that fits the most difficult period.
Details and Features
The worksheet includes a completed four-period frequency chart for one clearly named behavior. Students calculate four separate totals and one full-day total. Five analysis questions guide them through comparison, pattern recognition, possible causes, and strategy selection. The activity combines tally counting, behavior analysis, and written reflection on one page.