
About This Worksheet
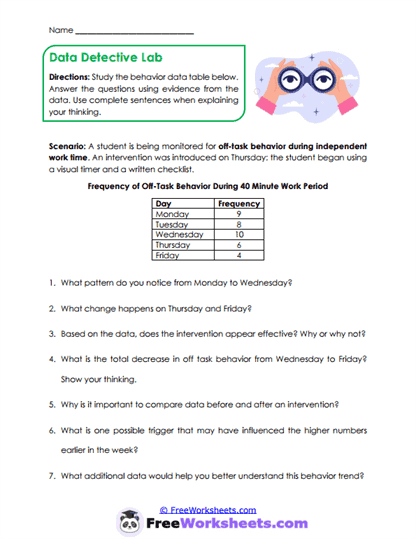
This worksheet is a behavior-data analysis activity that helps students study a weekly pattern and decide whether an intervention appears to be working. It is designed for students in grades 5 through 8 who can read a small table, compare values, and explain their thinking. Students examine five days of off-task behavior during independent work and notice that the numbers rise before dropping later in the week. For example, “The student improved” becomes “Off-task behavior decreased from ten times on Wednesday to four times on Friday.”
Curriculum and Grade Alignment
The main learning goal is to help students use numerical evidence when explaining changes in behavior. Students should already know how to read a frequency table and compare larger and smaller values. The next step is using several weeks of information to judge whether an intervention is working consistently. This activity supports Common Core standard CCSS.MATH.CONTENT.5.MD.B.2 through representing and interpreting measurement data, while also supporting CASEL self-awareness and responsible decision-making.
Student Tasks
On this worksheet, students will study a five-day table showing the frequency of off-task behavior during a forty-minute work period. They describe the pattern from Monday through Wednesday and then explain what changes on Thursday and Friday. Students calculate the total decrease from the highest day to the final day and decide whether the intervention appears effective. Additional questions ask them to suggest a possible trigger and identify more information that would help explain the trend.
Common Challenges and Misconceptions
Some students may decide that the intervention worked simply because Friday has the lowest number. Others may overlook the increase that happened earlier in the week or fail to use specific values in their explanation. Children may also treat a possible trigger as a proven fact even though the table does not explain why the behavior changed. Teachers can help by asking students to separate what the data clearly shows from what they are only suggesting.
Implementation Guidance
Teachers can use this worksheet during math lessons, behavior-support groups, intervention meetings, or data-literacy practice. It is especially useful for teaching students that numbers can show a pattern without giving every reason behind it. Parents and homeschool educators can connect the activity to home data, such as interruptions, unfinished tasks, or time spent working independently. Adults should encourage complete answers that include both a conclusion and the numbers that support it.
Details and Features
The worksheet includes a short scenario explaining the target behavior, work setting, and intervention used. A clear Monday-through-Friday frequency table provides the evidence for seven analysis questions. The questions move from simple pattern recognition to calculation, evaluation, and deeper thinking about triggers. The single-page format combines behavior science, math skills, and written reasoning.