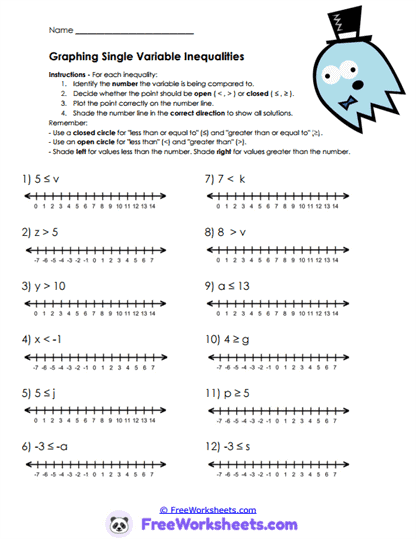
Graph Solutions On Number Lines
This worksheet teaches students how to graph single-variable inequalities on number lines using open circles, closed circles, and directional shading. Learners determine whether endpoints are included and identify which direction represents all possible solutions. The activity strengthens visual algebra understanding and connects symbolic inequalities to graphical representations. For example, students may graph y > 10 using an open circle at 10 and shading to the right. The worksheet also reinforces interpreting inequality symbols correctly.
Standards Connection
This worksheet supports Grade 9 algebra concepts involving graphing and interpreting inequalities on number lines. Students strengthen visual reasoning skills needed for algebra modeling and coordinate graphing. Learners should already understand inequality symbols and simple inequality solving before beginning this activity. The worksheet aligns with Common Core standard HSA-REI.B.3 through representing solution sets graphically. It also supports Algebra I standards involving algebraic interpretation and symbolic representation.
Graph And Shade Solutions
On this worksheet, students will graph inequalities by identifying the correct endpoint and shading direction on a number line. Learners decide whether to use open circles for strict inequalities or closed circles for inclusive inequalities. Some problems involve simple inequality statements while others require interpreting variable relationships first. Students also practice recognizing which direction represents greater-than or less-than solutions. The activity strengthens visual understanding of algebraic solution sets.
Common Difficulties
Many students confuse when to use open circles versus closed circles. Some learners shade the wrong direction because they misread the inequality symbol. Others forget that greater-than values extend to the right while less-than values extend to the left. Students may also struggle to connect symbolic notation to graphical meaning. Teachers can support understanding by modeling graph examples visually and encouraging students to test sample values mentally.
Teaching Applications
Teachers can use this worksheet during graphing lessons, visual algebra instruction, or intervention practice. Parents and homeschool educators may support students by reviewing number-line direction and inequality vocabulary before beginning the activity. The worksheet also works well for collaborative learning where students compare graphs and explain why certain endpoints are open or closed. Students benefit from visual graphing practice because it deepens conceptual understanding of solution sets. Number-line models help learners connect abstract algebra ideas to concrete representations.
Worksheet Features
The worksheet includes single-variable inequalities paired with number lines for hands-on graphing practice. Organized layouts support clear graphing, shading, and visual interpretation. Problems vary in structure to strengthen confidence with inclusive and non-inclusive inequalities. Student-friendly directions support classroom instruction and independent completion. The printable format works well for Algebra I classrooms, tutoring sessions, and homeschool mathematics lessons.