Solve And Graph Inequalities
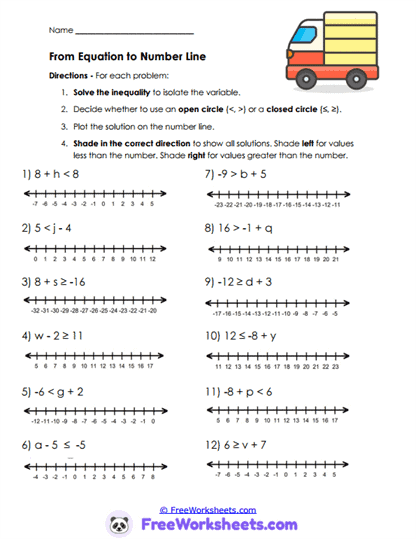
This worksheet teaches students how to solve inequalities and represent the solutions visually on number lines. Learners isolate variables, determine whether endpoints are included, and shade the correct direction to show all possible values. The activity strengthens algebra fluency while helping students connect symbolic solutions to graphical models. For example, students may solve 8 + h < 8 and graph all values less than 0 using an open circle. The worksheet also reinforces choosing between open and closed circles correctly.
Standards Connection
This worksheet supports Grade 9 algebra concepts involving solving and graphing inequalities in one variable. Students strengthen visual reasoning and procedural fluency needed for Algebra I graph interpretation. Learners should already understand inverse operations and basic inequality symbols before beginning this activity. The worksheet aligns with Common Core standard HSA-REI.B.3 through solving and graphing inequalities. It also supports Algebra I standards involving symbolic representation and number-line interpretation.
Solve Then Shade
On this worksheet, students will solve inequalities first and then graph the solutions on number lines. Learners practice isolating variables using inverse operations and identifying whether endpoints should be open or closed. Some problems involve positive numbers while others include negatives and multi-step solving. Students also shade the correct direction to display all possible solutions. The activity strengthens connections between algebra solving and graphical representation.
Common Difficulties
Many students solve inequalities correctly but graph the wrong direction on the number line. Some learners confuse open circles and closed circles after solving inclusive inequalities. Others make sign mistakes while isolating variables with subtraction or negatives. Students may also forget that the graph represents all possible solutions, not just one answer. Teachers can support understanding by encouraging students to test sample values after graphing.
Teaching Applications
Teachers can use this worksheet during graphing lessons, guided practice, or Algebra I intervention review. Parents and homeschool educators may support students by reviewing inequality symbols and number-line direction before beginning the activity. The worksheet also works well for partner learning where students compare graphs and explain why certain values are included. Students benefit from connecting solving and graphing because it deepens conceptual understanding of solution sets. Visual algebra practice strengthens long-term retention and confidence.
Worksheet Features
The worksheet combines inequality solving with graphing activities for comprehensive Algebra I practice. Organized number lines support clear visual representation of solutions. Problems vary in difficulty to strengthen confidence with graph interpretation and algebra solving. Student-friendly directions support classroom instruction and independent completion. The printable design works well for Algebra I classrooms, tutoring programs, and homeschool mathematics lessons.