Find Rate Of Change
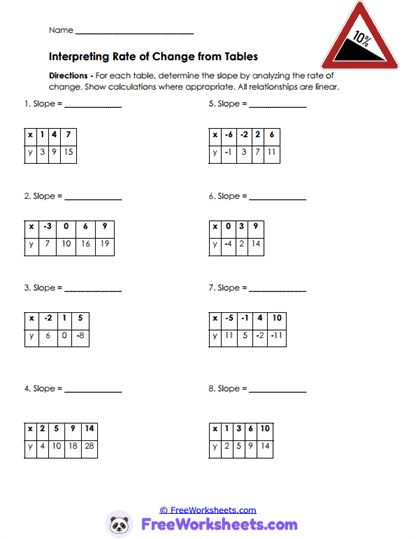
This worksheet teaches students how to determine slope and rate of change from tables of values. Learners analyze numerical patterns and calculate how y-values change compared to x-values. The activity strengthens understanding of linear relationships and helps students connect tables to slope concepts. For example, students may identify that y increases by 4 when x increases by 2, giving a slope of 2. The worksheet also reinforces recognizing whether relationships are linear.
Standards Connection
This worksheet supports Grade 9 algebra concepts involving slope, rate of change, and linear functions. Students strengthen analytical reasoning skills needed for interpreting functions and graphing equations. Learners should already understand coordinate relationships, subtraction, and fractions before beginning this activity. The worksheet aligns with Common Core standard HSF-IF.B.6 through interpreting and calculating average rate of change from tables. It also supports Algebra I standards involving linear relationships and function analysis.
Analyze The Tables
On this worksheet, students will examine tables of x-values and y-values to determine slope and rate of change. Learners calculate how much y changes for every change in x and decide whether the relationship stays consistent. Some tables involve positive rates of change while others include negative rates. Students also practice identifying whether the relationship is linear based on consistent differences. The activity strengthens pattern recognition and algebra reasoning.
Common Errors
Many students compare y-values without also considering the change in x-values. Some learners calculate differences incorrectly when negative numbers appear in the table. Others assume a relationship is linear even when the rate of change is inconsistent. Students may also forget to simplify slopes written as fractions. Teachers can support understanding by modeling how to calculate change step by step between consecutive table values.
Classroom Strategies
Teachers can use this worksheet during linear-function lessons, graphing review, or collaborative table-analysis activities. Parents and homeschool educators may support students by discussing how tables show trends and patterns in real life. The activity also works well for partner work where learners explain how they identified the rate of change. Students benefit from repeated table analysis because it builds stronger understanding of slope beyond graphs alone. Table-based slope practice prepares learners for future work with functions and equations.
Worksheet Features
The worksheet includes multiple tables with different linear relationships for broad slope practice. Organized answer spaces support careful calculations and clear written reasoning. Problems gradually vary in complexity to strengthen confidence and analytical thinking. Student-friendly directions support classroom instruction and independent completion. The printable format works well for Algebra I classrooms, tutoring sessions, and homeschool mathematics lessons.