Understand Rise And Run
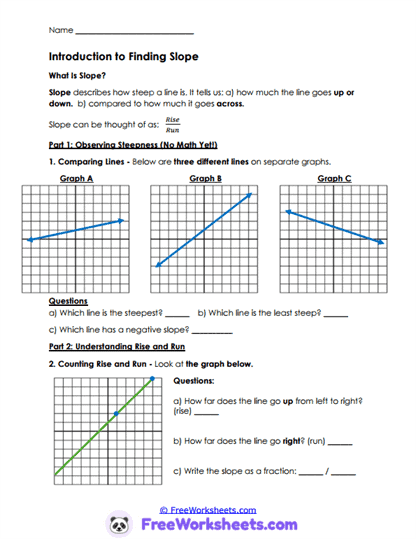
This worksheet introduces students to the concept of slope and explains how slope measures the steepness and direction of a line. Learners explore how slope compares vertical change, called rise, to horizontal change, called run. The activity strengthens graph-reading skills by helping students identify positive, negative, and steeper lines visually. For example, students compare multiple graphs to decide which line rises the fastest or slopes downward. The worksheet also reinforces writing slope as a fraction using rise over run.
Standards Connection
This worksheet supports Grade 9 algebra concepts involving slope, graph interpretation, and rate of change. Students strengthen foundational linear-function skills needed for graphing equations and analyzing relationships. Learners should already understand coordinate planes and ordered pairs before beginning this activity. The worksheet aligns with Common Core standard HSF-IF.B.6 through interpreting and analyzing rate of change from graphs. It also supports Algebra I standards involving linear relationships and slope interpretation.
Explore The Graphs
On this worksheet, students will compare lines drawn on coordinate grids and analyze how steep each line appears. Learners identify which lines have positive or negative slope and determine which graphs are steeper than others. Some problems involve counting rise and run directly from a graph to calculate slope as a fraction. Students also practice describing how lines move from left to right. The activity strengthens visual understanding of linear relationships and slope direction.
Common Difficulties
Many students confuse rise and run or count graph spaces incorrectly while finding slope. Some learners reverse the slope fraction by placing run over rise instead of rise over run. Others struggle to recognize that lines slanting downward from left to right have negative slope. Students may also overlook how steepness changes based on the size of the rise compared to the run. Teachers can support understanding by modeling graph movement step by step using arrows and color coding.
Teaching Applications
Teachers can use this worksheet during introductory slope lessons, graphing review, or collaborative classroom discussions. Parents and homeschool educators may support students by discussing real-world examples such as hills, ramps, or staircases to explain steepness. The activity also works well for partner learning where students compare slopes and explain their reasoning aloud. Learners benefit from connecting visual line movement to numerical slope values. Early slope practice helps students build confidence before working with linear equations.
Worksheet Features
The worksheet includes graph comparisons, rise-and-run counting activities, and slope-fraction practice for balanced instruction. Organized graph layouts help students focus clearly on each line relationship. Problems gradually increase in complexity to strengthen confidence and graph-reading accuracy. Student-friendly directions support classroom instruction and independent completion. The printable format works well for Algebra I classrooms, tutoring sessions, and homeschool mathematics lessons.