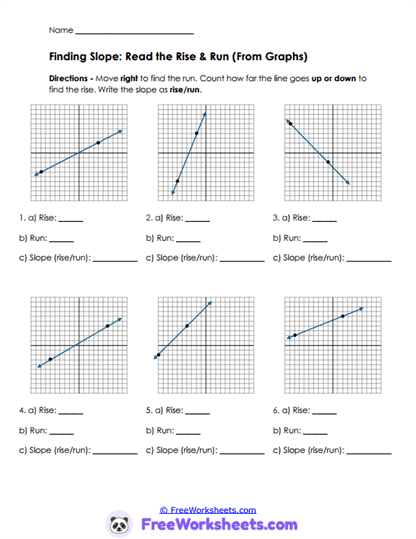
Read Slope From Graphs
This worksheet teaches students how to calculate slope directly from graphed lines by counting rise and run. Learners analyze coordinate grids and determine how far a line moves vertically and horizontally between two points. The activity strengthens graph interpretation skills and reinforces slope as a rate of change. For example, students may identify that a line rises 3 units while running 5 units to the right, giving a slope of 3/5. The worksheet also helps learners recognize positive and negative slopes visually.
Standards Connection
This worksheet supports Grade 9 algebra concepts involving linear functions, slope, and graph interpretation. Students strengthen graphing and analytical reasoning skills needed for solving linear equations and interpreting functions. Learners should already understand coordinate grids and ordered pairs before beginning this activity. The worksheet aligns with Common Core standard HSF-IF.B.6 through interpreting slope as rate of change from graphs. It also supports Algebra I standards involving linear relationships and graphical analysis.
Count Rise And Run
On this worksheet, students will analyze graphed lines and calculate slope using rise-over-run relationships. Learners count vertical movement and horizontal movement carefully between marked points on a graph. Some lines involve positive slope while others include negative slope moving downward from left to right. Students also practice simplifying slope fractions when possible. The activity strengthens graph-reading accuracy and procedural fluency with slope calculations.
Frequent Errors
Many students count graph spaces incorrectly because they skip points or move in the wrong direction. Some learners reverse rise and run when writing the slope fraction. Others forget that downward movement creates negative slope values. Students may also make mistakes simplifying fractions after calculating slope. Teachers can support understanding by encouraging learners to trace movements carefully with arrows before writing the final slope.
Classroom Strategies
Teachers can use this worksheet during slope instruction, graphing practice, or algebra review sessions. Parents and homeschool educators may support students by practicing graph counting and discussing how slope represents change over distance. The activity also works well for partner discussions where learners compare slope calculations and explain mistakes. Students benefit from repeated graph practice because it builds confidence interpreting lines visually. Graph-based slope work helps prepare learners for linear equations and function analysis.
Worksheet Features
The worksheet includes multiple graph problems with clearly marked points for rise-and-run analysis. Organized response spaces allow students to record rise, run, and slope calculations neatly. Problems vary in steepness and direction to strengthen flexibility with slope interpretation. Student-friendly directions support classroom instruction and independent completion. The printable design works well for Algebra I classrooms, tutoring programs, and homeschool mathematics lessons.