
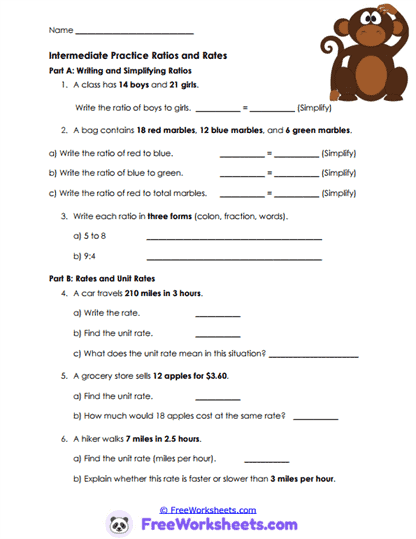
About This Worksheet
This worksheet helps students understand proportional relationships through visual models, shading activities, and comparison diagrams. Learners use shapes, bars, grids, and symbols to represent numerical relationships visually. Students connect numerical forms with visual representations while simplifying and interpreting relationships. For example, students shade bar models to represent comparisons such as 3:5 and determine the fractional meaning of the first quantity. This activity strengthens conceptual understanding through hands-on visual reasoning.
Curriculum and Grade Alignment
This worksheet focuses on interpreting and representing proportional relationships visually. Students should already understand fractions, equivalent relationships, and basic ratio notation before beginning this activity. The primary learning goal is helping learners connect visual models to symbolic mathematical relationships. After mastering these skills, students are better prepared for scaling, graphing proportional relationships, and algebraic modeling. The worksheet aligns with Common Core standards 7.RP.A.1 and 7.RP.A.2, along with TEKS 7.4A involving proportional reasoning and visual representations.
Student Tasks
On this worksheet, students will
shade models, interpret visual relationships, simplify comparisons, and connect symbolic forms to diagrams. Students work with grids, bars, shapes, and object groups to represent relationships visually. Learners determine fractional meanings and simplify comparisons using visual evidence. Several activities encourage students to explain how models represent numerical relationships. Students also practice translating between visual and symbolic mathematical forms.
Common Challenges and Misconceptions
Some students may incorrectly count shaded or unshaded portions within models. Others can struggle connecting diagrams to symbolic notation accurately. Learners sometimes simplify relationships incorrectly after shading models. Students may also confuse part-to-part and part-to-whole relationships within visual examples. Teachers can support understanding by modeling one complete visual example before independent practice.
Implementation Guidance
Teachers may use this worksheet during visual modeling lessons, introductory proportional reasoning units, or intervention practice. The visual approach supports conceptual understanding for learners who benefit from concrete representations. Parents and homeschool educators can complete one model together before assigning independent work. Students often benefit from using colored pencils or markers while solving. This worksheet also works well for small-group instruction, tutoring sessions, or math centers.
Details and Features
This printable worksheet includes visual comparison models with organized shading and labeling activities. The engaging layout supports conceptual understanding and mathematical reasoning. Visual representations encourage students to connect abstract relationships with concrete models. Problems are designed to strengthen proportional reasoning and visual interpretation skills. The worksheet prints clearly for classroom instruction, tutoring support, or homeschool learning.