About This Worksheet
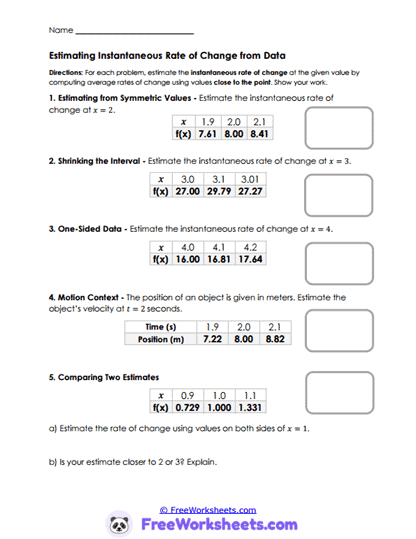
Derivatives describe how quickly a function changes at a specific moment. This worksheet helps students estimate instantaneous rates of change by comparing nearby function values from tables. Students examine values close to a target point and estimate the slope near that location. For example, students compare function outputs near x = 2 or x = 3 to estimate derivative values. The activity helps students build an intuitive understanding of derivatives before formal limit notation.
Curriculum and Grade Alignment
This worksheet supports introductory calculus standards involving instantaneous rate of change and derivative estimation. The main learning goal is to estimate derivatives from numerical data. Students should already understand average rate of change before beginning. The next learning step is learning formal derivative definitions and differentiation rules. This aligns with introductory calculus standards involving conceptual understanding of derivatives.
Student Tasks
On this worksheet, students will estimate derivatives using nearby table values. They will compare changes across shrinking intervals and explain their reasoning. Students also estimate motion-based rates of change from real-world data tables. Several problems ask learners to compare multiple derivative estimates and determine which value is most reasonable.
Common Challenges and Misconceptions
Some students may confuse average rate of change with instantaneous rate of change. Others may use points that are too far apart when estimating slopes. A common mistake is ignoring how values change on both sides of the target point. Teachers can help by emphasizing that closer intervals usually give better estimates.
Implementation Guidance
This worksheet works well before introducing formal derivative formulas. Teachers can model how to calculate small interval slopes step by step. Parents helping at home can encourage students to describe what “change per step” means in simple language. Real-world examples like speed often make the idea easier to understand.
Details and Features
The worksheet includes numerical tables, symmetric interval comparisons, one-sided estimates, and motion-based applications. Students practice interpreting changing values and estimating slopes numerically. The printable format provides organized spaces for calculations and written explanations. The progression supports conceptual readiness for formal derivative work.