Visual Elements Worksheets
Grade 3 reading visual elements worksheets help students understand how pictures, diagrams, charts, graphs, timelines, and illustrations support meaning in both fiction and nonfiction texts. Free, ready-to-print worksheets are available in PDF format for immediate classroom use and independent practice. Students strengthen skills such as interpreting visual information, comparing text and graphics, and using illustrations to deepen comprehension.
About This Collection of Worksheets
Visual elements play an important role in helping readers understand information, organize ideas, and make sense of complex concepts. This collection introduces students to a wide variety of visual tools commonly found in informational and literary texts. Through engaging activities, learners discover how charts, diagrams, timelines, graphs, illustrations, and photographs provide valuable information that supports written content.
The worksheets encourage students to move beyond simply looking at visuals and begin analyzing how they contribute to meaning. Students practice comparing information presented in text and graphics, interpreting data displays, identifying details shown through illustrations, and evaluating why authors choose specific visual elements. These experiences help readers become more thoughtful consumers of information and strengthen their overall comprehension skills.
Teachers, parents, and homeschool educators can use these resources to support reading instruction across multiple subject areas, including science, social studies, and language arts. The focused design of each worksheet allows students to develop one visual literacy skill at a time while building confidence in using multiple sources of information. Together, these activities help learners become stronger readers who understand how visuals and text work together to communicate ideas.
Paul’s Teacher Tip
Encourage students to treat visuals as an important source of information rather than something extra to look at after reading. Before discussing a text, ask learners what they notice in the chart, graph, illustration, or diagram and how it connects to the written information. Modeling how to move back and forth between visuals and text helps students develop stronger comprehension habits. It can also be helpful to ask students what information they learned from the visual that was not immediately obvious in the passage. As students become more confident, challenge them to explain why an author selected a specific visual and how a different visual might change the reader’s understanding. These conversations build strong visual literacy skills that support learning across all subjects.
Worksheet Collection Skill Spotlights
Chart Connections
- What Kids Do:
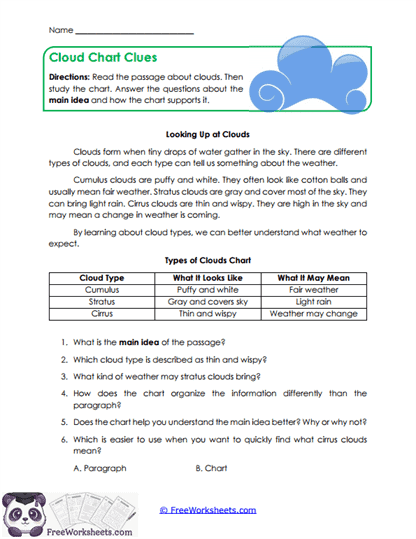
Students read an informational passage about cloud types and examine a chart that organizes the same information visually. They answer questions about details, comparisons, and main ideas while evaluating how the chart supports understanding of the topic. - Target Skill:
Students strengthen their ability to interpret charts and connect visual information to written content. This supports stronger nonfiction comprehension and organizational thinking.
Data Comparisons
- What Kids Do:
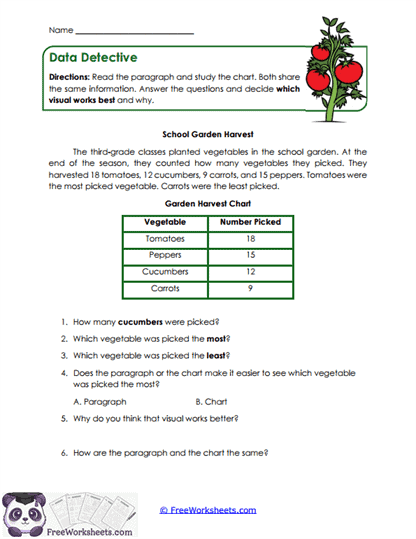
Students compare information presented in a school garden paragraph and a matching data chart. They analyze quantities, trends, and comparisons while discussing the advantages of each format for communicating information. - Target Skill:
Students develop skills in comparing visual and written information and evaluating how different formats communicate ideas effectively.
Diagram Purpose
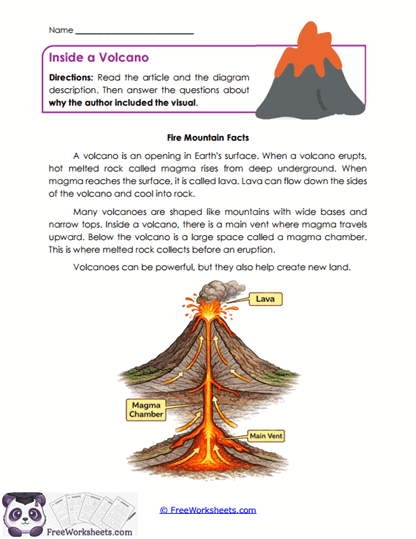
- What Kids Do:
Students read an article about volcanoes and study a labeled diagram that highlights important features. They answer questions using both sources and explain why the author included the diagram. - Target Skill:
Students learn how diagrams support nonfiction comprehension by providing information that may be difficult to communicate through text alone.
Diagram Choices
- What Kids Do:
Students read a science passage about a butterfly life cycle and determine which visual element would best support the information. They justify their choices and explain how the visual would improve reader understanding. - Target Skill:
Students strengthen visual analysis skills by evaluating which types of visuals best support specific informational content.
Feeling Pictures
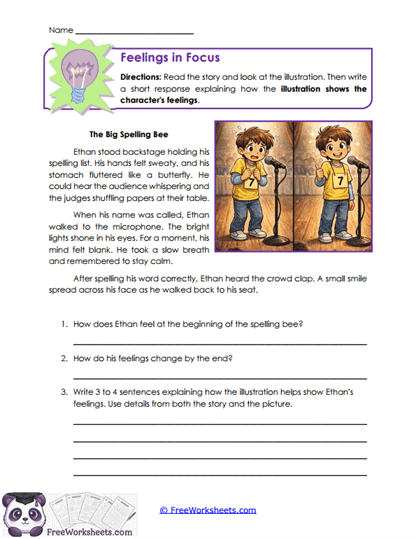
- What Kids Do:
Students read a story about a spelling bee and analyze an accompanying illustration. They identify character emotions and explain how visual clues such as facial expressions and body language support the text. - Target Skill:
Students build the ability to interpret character feelings using both illustrations and written details, strengthening literary comprehension.
Graph Findings
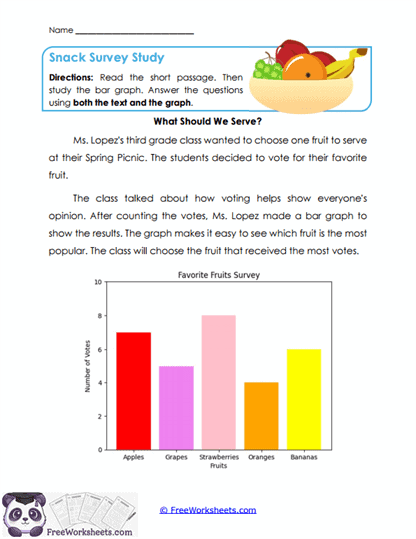
- What Kids Do:
Students read a classroom survey passage and examine a related bar graph. They answer questions using information from both sources and explain how the graph helps organize and communicate results. - Target Skill:
Students develop graph-reading and informational reading skills by gathering evidence from both text and visual displays.
Lifecycle Sketches
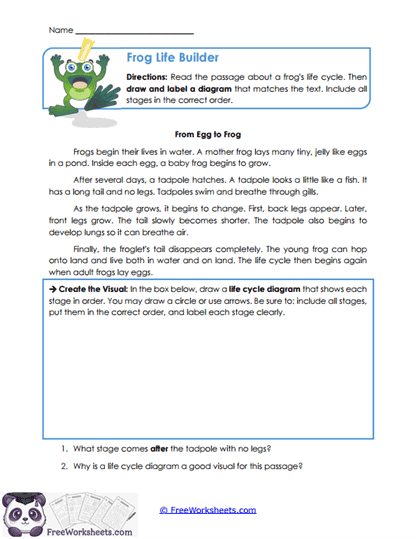
- What Kids Do:
Students read an informational passage about a frog’s life cycle and create their own labeled diagram showing each stage. They organize information visually and answer follow-up comprehension questions. - Target Skill:
Students strengthen sequencing and informational comprehension by transforming written information into a visual representation.
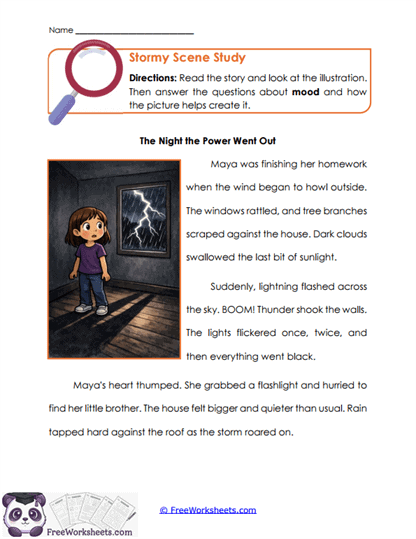
Mood Illustrations
- What Kids Do:
Students read a story set on a stormy night and examine an illustration that contributes to the atmosphere. They analyze visual details and explain how the illustration helps create the story’s mood. - Target Skill:
Students learn how illustrations influence mood and atmosphere while strengthening literary analysis and visual literacy skills.
Picture Partners
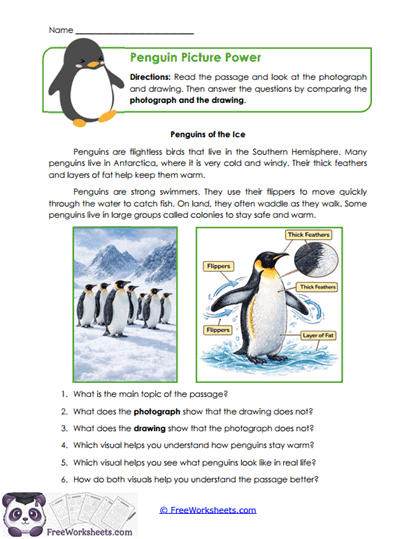
- What Kids Do:
Students compare a photograph and a labeled drawing about penguins. They examine what each visual communicates and discuss how both contribute unique information to reader understanding. - Target Skill:
Students develop visual comparison skills by analyzing the strengths and purposes of different types of visuals.
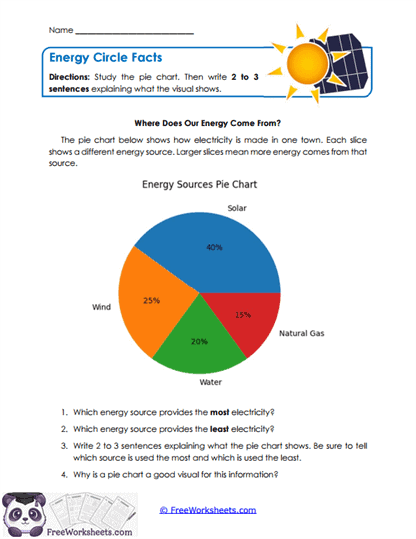
Pie Insights
- What Kids Do:
Students interpret a pie chart showing different energy sources and answer questions about categories, proportions, and overall trends. They summarize what the visual communicates and explain why a pie chart is effective. - Target Skill:
Students strengthen data interpretation skills and learn how pie charts help readers understand parts of a whole.
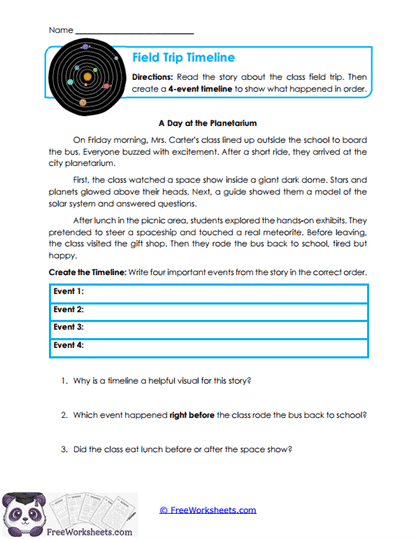
Timeline Builder
- What Kids Do:
Students read a story about a class field trip and place major events in chronological order on a timeline. They answer questions about sequence and explain how timelines support comprehension. - Target Skill:
Students build sequencing and organizational skills by using timelines to visualize the order of events.
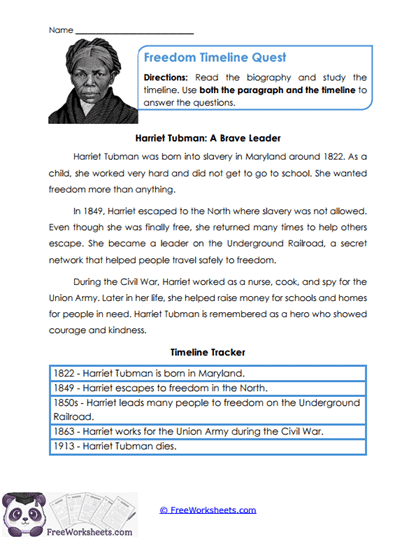
Timeline Evidence
- What Kids Do:
Students read a short biography of Harriet Tubman and analyze a supporting timeline. They use both sources to answer questions, identify key events, and examine chronological relationships. - Target Skill:
Students strengthen informational reading an