About This Worksheet
This worksheet focuses on using a bar graph together with a written article to gather information and answer questions. Graphs are important text features because they present data in a visual way that can be understood quickly. Third-grade students strengthen informational reading skills when they learn to compare information from text and graphics. For example, a graph can help readers see temperature changes more easily than a paragraph alone. This activity helps students combine multiple sources of information to improve comprehension.
Curriculum and Grade Alignment
This worksheet is designed for Grade 3 students studying informational text features and data interpretation. The primary learning goal is reading a bar graph and using it alongside written text. Students should already understand how to read basic graphs and charts. The next progression involves comparing information across multiple text features and drawing conclusions from data. This activity aligns with CCSS RI.3.7 and supports TEKS 3.9F by helping students interpret information presented visually.
Student Tasks
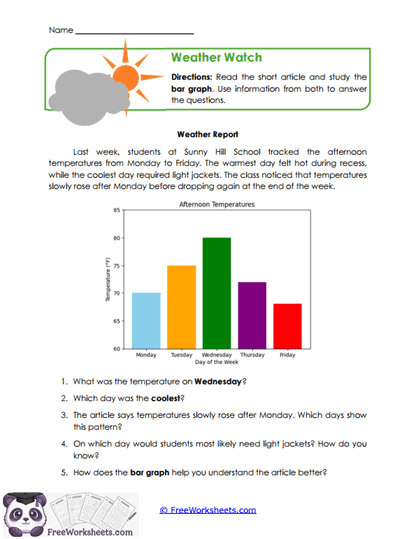
On this worksheet, students will read a short weather report and examine a bar graph showing temperatures throughout the week. They will answer questions using information from both the article and the graph. Learners must identify specific temperatures, recognize trends, and explain patterns shown in the data. Students also reflect on how the graph improves understanding of the article. The activity develops reading comprehension, critical thinking, and data-analysis skills.
Common Challenges and Misconceptions
Many students focus only on the graph or only on the article instead of using both sources. Some learners misread the graph scale or confuse the days being compared. Others can find information but struggle to explain patterns and trends. Readers sometimes overlook how the graph visually supports the article’s main ideas. Teachers should encourage students to move back and forth between the graph and text while answering questions.
Implementation Guidance
Teachers can use this worksheet during lessons on text features, informational reading, or science and weather units. It works well as a cross-curricular activity that combines reading and math skills. Parents may discuss weather reports and graphs found online or in newspapers. Homeschool educators can extend learning by having students create their own weather graphs. The worksheet strengthens both literacy and data interpretation skills.
Details and Features
The worksheet includes a weather article paired with a clear bar graph. Students answer comprehension and analysis questions using both sources of information. Reflection questions encourage deeper understanding of why graphs are useful. The printable format supports classroom instruction, homework assignments, intervention groups, and homeschool learning. Its real-world topic makes graph reading meaningful and engaging.