About This Worksheet
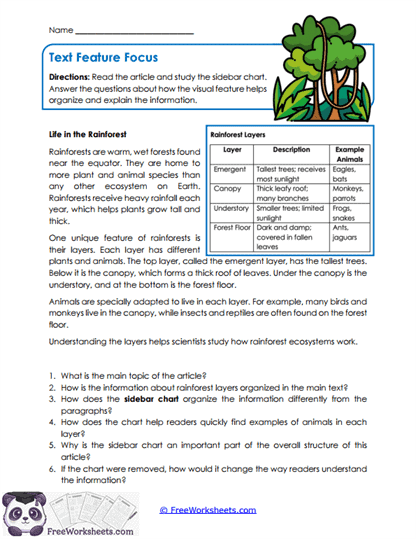
This worksheet is a visual elements activity that focuses on how charts and diagrams organize and clarify information within a text. It is designed for Grade 5 students who are learning to use multiple sources within a single page to build understanding. Students read about rainforest layers and then analyze a sidebar chart that organizes key details. For example, a chart showing each layer with descriptions and examples helps students quickly compare information that would be harder to track in paragraph form.
Curriculum and Grade Alignment
This worksheet supports Grade 5 students in integrating information from text and visual features. It emphasizes understanding how charts organize complex information into clear categories. It aligns with Common Core RI.5.7, which focuses on drawing information from multiple sources. It also connects to TEKS 5.9F for analyzing visual elements in informational texts.
Student Tasks
On this worksheet, students will read an article about rainforest ecosystems and examine a sidebar chart. They answer questions about how the chart supports and organizes the information from the text. Students compare how information is presented in paragraphs versus the chart. They also explain why the chart makes certain details easier to understand.
Common Challenges and Misconceptions
Students may read only the article and ignore the chart entirely. Others might look at the chart but not connect it back to the text. Some may describe the chart without explaining how it helps understanding. Teachers can model how to use both sources together to build a complete picture.
Implementation Guidance
Teachers can use this worksheet during science or reading lessons focused on ecosystems. It works well as a guided activity where students discuss how charts help organize information. Parents can use it at home to support reading comprehension and science learning. It is especially useful for helping students learn to study and take notes from visuals.
Details and Features
The worksheet includes a detailed article and a clearly organized sidebar chart. It provides thoughtful questions that guide students to compare both sources. The layout is clean, engaging, and easy to print. It supports both comprehension and analytical thinking.
Curriculum Overlap
Understanding charts helps students organize and interpret information in science and math. This skill supports writing by helping students present information clearly using structured formats. It also improves study habits when working with textbooks and reference materials.
- Supports science and math data organization
- Improves structured writing skills
- Strengthens study and note-taking habits
- Builds comprehension of informational texts