About This Worksheet
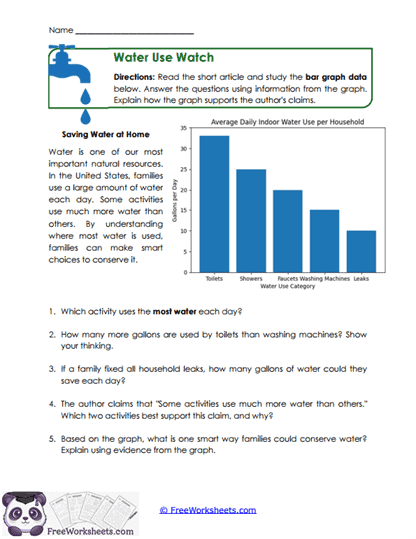
This worksheet is a text features activity that focuses on interpreting bar graphs alongside informational text. It is designed for Grade 5 students learning how visuals support written information. Students analyze how data in a graph connects to claims in a passage. For example, a bar showing higher water use for toilets supports the idea that some activities use more water.
Curriculum and Grade Alignment
This worksheet supports Grade 5 students in understanding how visual data connects to text. It focuses on interpreting graphs and using evidence from visuals. It aligns with Common Core RI.5.7, which involves integrating information from multiple sources. It also connects to TEKS 5.9F for analyzing visual features.
Student Tasks
On this worksheet, students will read a short article about water use and study a bar graph. They answer questions using both the text and the graph. Students compare data points and explain differences in water usage. They also explain how the graph supports the author’s claims.
Common Challenges and Misconceptions
Students may focus only on the text and ignore the graph. Others might read the graph incorrectly or miss key details like labels and units. Some may give answers without explaining how the graph supports their thinking. Teachers can model how to read each part of the graph carefully.
Implementation Guidance
Teachers can use this worksheet during lessons on nonfiction reading or data interpretation. It works well as a cross-curricular activity connecting reading and math. Parents can use it to help children practice reading charts and graphs at home. It encourages students to think about how visuals and text work together.
Details and Features
The worksheet includes a clear bar graph and a short informational passage. It provides guided questions that require students to use both sources. The design is clean and easy to print. It supports both reading comprehension and data analysis skills.