About This Worksheet
This worksheet is a visual elements activity that focuses on comparing different types of graphs to understand the same data. It is designed for Grade 5 students who are learning how visuals can present information in different ways. Students analyze a bar graph and a pie chart that display the same data and evaluate which is clearer. For example, one graph may show exact numbers while another highlights proportions.
Curriculum and Grade Alignment
This worksheet supports Grade 5 students in interpreting and comparing visual data representations. It focuses on understanding how different graphs serve different purposes. It aligns with Common Core RI.5.7 and math data standards. It also connects to TEKS 5.9F for analyzing visual features.
Student Tasks
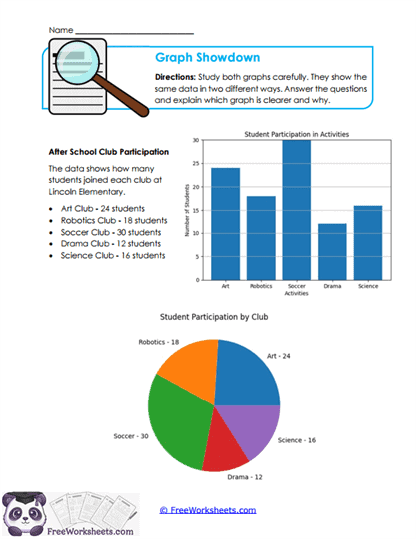
On this worksheet, students will study both a bar graph and a pie chart showing club participation. They answer questions using the data from both graphs. Students compare how each graph presents the information. They explain which graph is clearer and why, using evidence from the visuals.
Common Challenges and Misconceptions
Students may focus on one graph and ignore the other. Others might describe the graphs without comparing them. Some may struggle to explain why one graph is clearer. Teachers can model how to compare visuals based on clarity and purpose.
Implementation Guidance
Teachers can use this worksheet during math or reading lessons. It works well as a discussion activity where students justify their opinions. Parents can use it at home to support data interpretation. It helps students connect math and literacy skills.
Details and Features
The worksheet includes both a bar graph and a pie chart with the same data set. It provides structured questions for comparison and explanation. The layout is clear and easy to print. It supports both analysis and reasoning.
Curriculum Overlap
Comparing graphs helps students understand data representation in math and science. This skill supports critical thinking and decision-making. It also improves students’ ability to explain information clearly.
- Supports math data analysis skills
- Builds critical thinking and comparison skills
- Improves reasoning and explanation
- Strengthens interpretation of visuals