Visual Elements Worksheets
Grade 5 Reading Visual Elements worksheets help students understand how images, charts, graphs, and diagrams support what they read. These free, ready-to-print PDF worksheets are simple to use at home or in the classroom. Students learn how to connect visuals with text, making reading clearer and more meaningful.
About This Collection of Worksheets
If your child can read a passage but struggles to understand charts, graphs, or diagrams, they’re not alone-that’s exactly what this collection is designed to help with.
In Grade 5, students are expected to go beyond just reading words. They need to use both text and visuals together to fully understand information. These worksheets give them guided practice doing just that.
You’ll see activities that ask students to read a short passage, then use a timeline, chart, map, or diagram to answer questions. This helps them learn how visuals add meaning, not just decoration. Over time, students become more confident reading real-world materials like textbooks, articles, and even online content.
These worksheets are easy to print, require little prep, and work well for homework, extra practice, or small group support.
Paul’s Teacher Tip
One of the biggest mistakes students make is skipping the visual entirely. They read the paragraph, answer the question, and ignore the chart or image-even when the answer is right there.
A simple fix: before your child starts reading, say, “Find the visual first.” Ask them:
- What kind of visual is this?
- What is it trying to show me?
Then have them go back and read the text.
This small habit trains them to use both sources together, which is exactly what Grade 5 expects.
If your child needs extra support, focus on just one type of visual at a time (like graphs or maps). If they’re ready for more of a challenge, ask them: “What does the visual show that the text does NOT?” That’s where deeper thinking really starts to happen.
Worksheet Collection Skill Spotlights
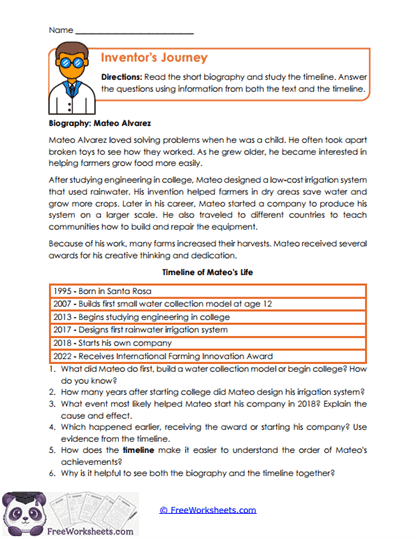
Inventor’s Journey
- What Kids Do:
Students read a biography and use a timeline to understand how events connect over time. - Target Skill:
Helps students connect written information with timelines to understand sequence more clearly.
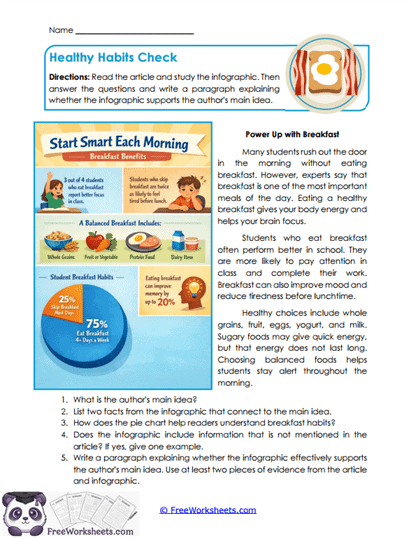
Healthy Habits Check
- What Kids Do:
Learners read an article and analyze an infographic to explain how both support the main idea. - Target Skill:
Builds the ability to combine information from text and visuals.
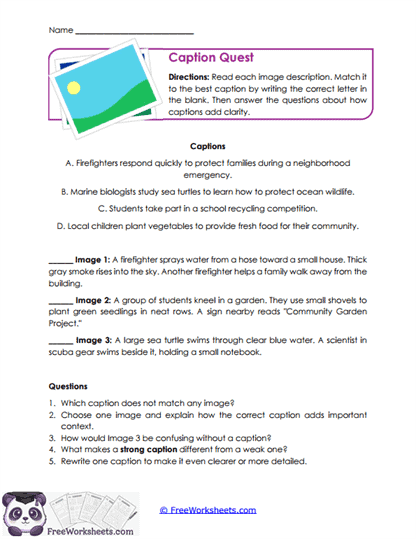
Caption Quest
- What Kids Do:
Students match captions to images and improve weak captions by rewriting them. - Target Skill:
Strengthens understanding of how captions clarify visual meaning.
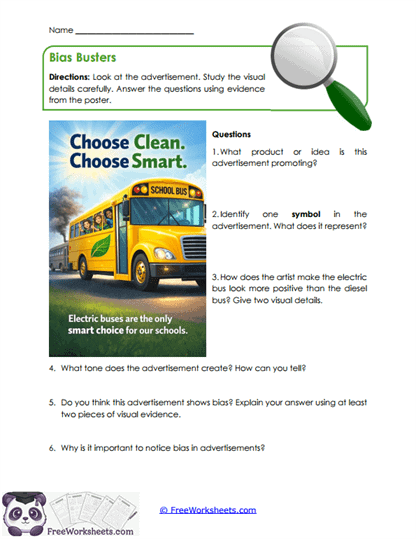
Bias Busters
- What Kids Do:
Learners analyze an advertisement to identify bias and persuasive visual elements. - Target Skill:
Builds critical thinking and media awareness.
Storm System Sketch
- What Kids Do:
Students read about hurricanes and create a labeled diagram to explain the process. - Target Skill:
Helps students turn written information into visual understanding.
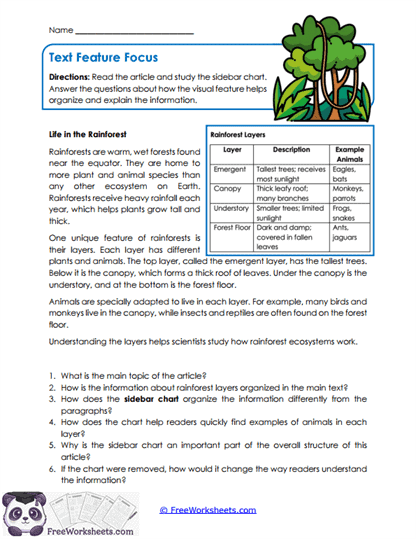
Text Feature Focus
- What Kids Do:
Learners compare a written passage with a chart to see how information is organized differently. - Target Skill:
Builds understanding of how charts simplify complex ideas.
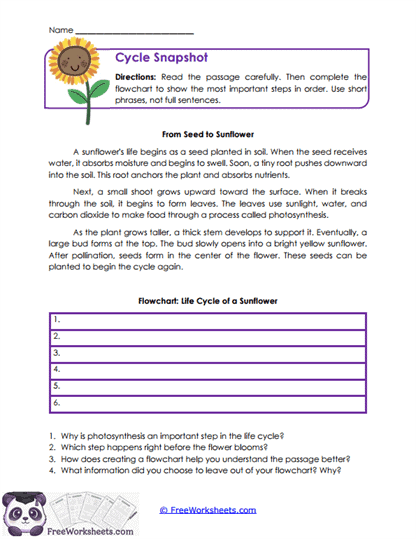
Cycle Snapshot
- What Kids Do:
Students create a flowchart showing the steps of a plant life cycle. - Target Skill:
Strengthens sequencing and organization skills.
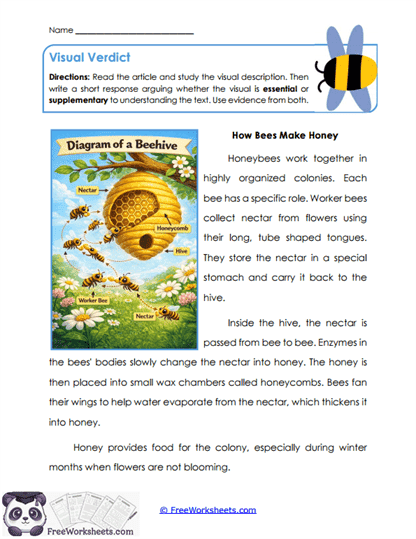
Visual Verdict
- What Kids Do:
Learners decide if a diagram is essential or just helpful, using evidence to explain. - Target Skill:
Builds deeper thinking about the purpose of visuals.
Ocean Energy Detectives
- What Kids Do:
Students separate what they learn from text versus images and explain how both work together. - Target Skill:
Improves multi-source comprehension skills.
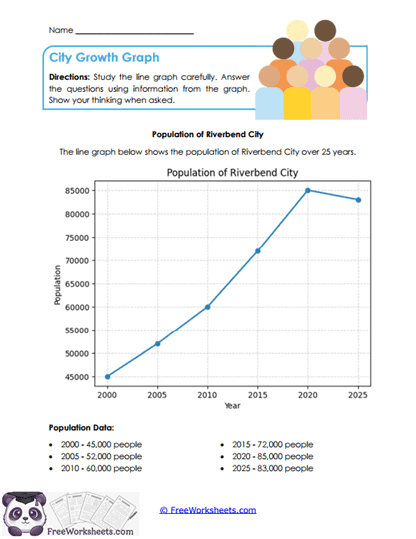
City Growth Graph
- What Kids Do:
Learners read and interpret a line graph to answer questions about trends. - Target Skill:
Builds data interpretation and graph-reading skills.
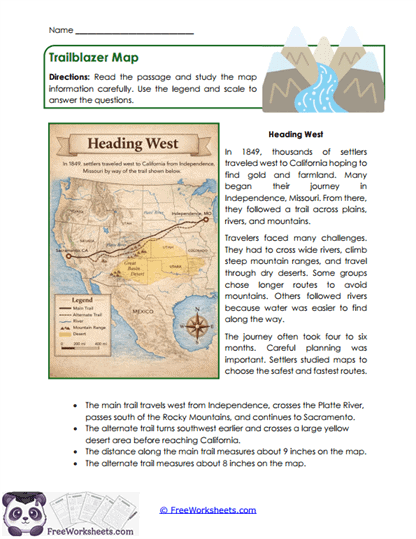
Trailblazer Map
- What Kids Do:
Students use a map, legend, and scale to understand routes and distances. - Target Skill:
Develops real-world map reading and spatial reasoning.
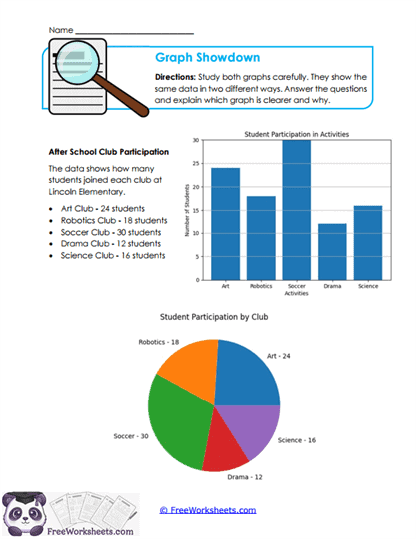
Graph Showdown
- What Kids Do:
Learners compare a bar graph and pie chart to decide which is clearer and why. - Target Skill:
Builds comparison and evaluation of different visual formats.